SEC S18-W1 || Mastering the Markets with technical analysis.
|
|---|
Hope you all are doing well and good and enjoying the best days of your life. This is me @shahid2030 from Pakistan and you are here reading my post. You all are welcome here from the core of my heart.
This is my participation in a contest Mastering the Markets with technical analysis organized in SteemitCryptoAcademy by @crypto-academy.
What is the importance of technical knowledge in trading? Describe the key components and information you can gather from a technical chart. |
|---|
Technical knowledge in trading plays a very crucial role. It helps traders make informed decisions based on historical price data and current market trends. Technical Analysis (TA) allows traders to identify patterns, gauge market sentiment, and predict future price movements. It gives a precise data for best for best entry and exit point.
Let me mention some prominent benefits of Technical Knowledge in Trading.
Predicting Market Movements
TA first and far most importance is, it gives us the expected price movement of the market. We study and analyze past price data and current market behavior to give future prediction.
Identifying Trends
Trend identification is too much important in trading, because it create sentiments in the market. It is essential for strategic planning, which helps the traders to decide their position. Best strategy is, never going against trend.
Risk Management
The traders put stoplosss (SL) and take profit (TA) according to their analysis. It helps them managing their risk exposure more effectively.
Key Components of a Technical Chart
Price
The most fundamental component of technical chart is it gives us a price data, both of past and present. Along with it, it gives us a complete market moment of a stock or commodity ( any crypto currency). This thing is very crucial, because we can make our analysis using this data. Price data can be displayed as line charts, bar charts, or candlestick charts. Candlestick chart pattern is the most commonly used one.
Volume
We can also find the current market volume, which indicates the number of shares or contracts traded in a crypto coin or other commodity. Volume spikes can signal strong buying or selling pressure.
Support and Resistance Levels
Support and Resistance are the two important levels in chart. Support is a price level where we can expect an uptrend due to a concentration of high demand. We put our stoploss below support level. However resistance is quite opposite to it. Resistance is a price level where an up trend can be expected to pause, because it is considered to be a high selling pressure zone.
Explain how to read candlestick charts and the significance of different time frames in trading. |
|---|
Candlestick chart is popular way of analyzing and making trading decisions in the financial markets. Understanding how to read candlestick charts can greatly enhance a trader's ability and develop effective trading strategies and making informed decisions.
Let me explain The Basic Structure of a Candlestick.
We have basically two parts of candles; The Body and The wick.
Body
This is a rectangular part of the candlestick, which shows us the opening and closing prices of the asset. Green candles show us an uprise in prices while red candle show us a down move in price.
Wick
The thin lines above and below the body is called wick. Some people call it shadow. The upper wick shows the highest price during the period, while a lower wick shows us a the Lowest price during a period.
Some Key Candlestick Patterns
Doji
It is a candle where the opening and closing prices are very close, mean the market has shown very less movement. It's opening and closing are too near to each other.
Hammar
This is a candle with a small body a long lower wick. It indicates a bullish reversal after a downtrend.
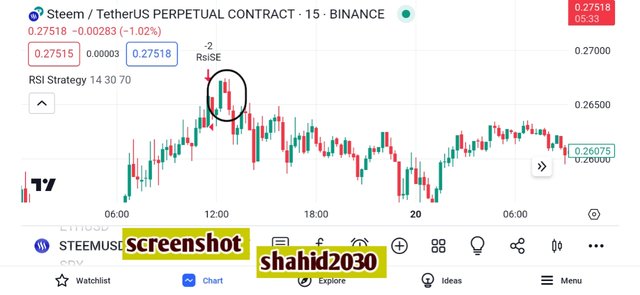
Shooting Star
This candle is somehow opposite to Hanging hammar. It has small body and a long upper wick, which indicates a bearish tend and the end of bullish trend.
Engulfing Patterns
Here we have two candles pattern. A small and a large. A small candle is formed first, followed by a larger candle that 'engulfs' the previous one. It has now two types.
a) Bullish Engulfing
As the name indicates it will take the market towards bullish trend. Here we a small red candle or bearish candle is formed first. It is followed by a large green candle or bullish candl, which engulfe the previous bearish small candle.
b) Bearish Engulfing
It is a bearish candle which indicates a down trend. It is completely opposite to that of Bullish Engulfing. Here first a small bullish candle is formed, followed by a large bearish candle, which engulfe the previous bullish candle.
Morning Star
This is a three candle pattern, which indicate a bearish reversal mean it tell that bullish trend is starting soon. It is formed where we have a large red or bearish candle, followed by a small bullish (green) candle and then by another large bullish candle.
Evening Star
Evening star in opposite to Morning star. It is a Bearish trend pattern. First we have a large bullish candle, followed by a small bearish candle and then by another large bearish candle.
What are the Significance of Different Time Frames in Trading ?
Let's us know first that we have basically three time frames; Intraday Time Frames, Short-Term Time Frames and Long-Term Time Frames. Let me explain these one by one.
1) Intraday Time Frames (e.g., 1-minute, 5-minute, 15-minute charts)
This is the shortest time frame range from few minutes to few hours, but not more than one day. We use one minute, five minutes and fifteen minutes time frame chart for it. It is used by day traders for making quick trades within the same trading day. We have one type of day trading too, called Scalping.
Pros/Cons
• You may make profit even in small market movement.
• It also gives you a brief insight of the current market.
• High volatility may cause a sufficient lost, if you are inexperienced.
2) Short-Term Time Frames (e.g., 1-hour, 4-hour charts)
We also call it a mid term time frame. Mostly thirty minutes, one hour and four hours time frame are used for it. It's holding time is from few days to few weeks, but not exceed one month.
Pros/Cons
• It offers a clear picture of the market.
• It in between intra day and long term investment.
• You may miss more short term opportunities.
Long-Term Time Frames (e.g., daily, weekly, monthly charts)
This is the largest time frame we have in crypto market. Here we use daily, weekly and monthly time frame charts to analyse the market. It is used by position traders and investors who hold positions for months or years. We have one month minimum duration of it and maximum is upto years.
Pros/Cons
• It shows us a long-term trends and helps in understanding the broader market context.
• In crypto long term investment or position trading is the most profitable one.
• It is too slow to react to market changes.
Multi-Time Frame Analysis
Some traders often use multiple time frames to get a comprehensive view of the market.
They start with a higher time frame to identify the overall trend (daily chart or weekly chart) then zoom in to lower time frames ( 4 hours or 15 minutes time frames) for precise entry and exit points.
Example We have a trader who use the daily chart to identify a long-term trend, the 4-hour chart to confirm the direction of the trend and the 15-minute chart to get a specific entry or exit.
Define chart patterns and differentiate between continuation patterns and reversal patterns. How can chart patterns be utilized to set effective stop-loss orders |
|---|
Chart patterns are the formations created by the price movements of the assets. Using these patterns technical analysts interpret and predict future price behavior of the market. Actually these patterns are visual representations of the supply and demand dynamics in the market, reflecting the collective behavior of buyers and sellers. We have two types of chart patterns; Continuation patterns and Reversal patterns.
Continuation Patterns
As it's name indicates, it means that the current trend will continue after a brief period of consolidation. Continuation patterns suggest that the market is taking a pause before resuming its previous direction. Some common continuation patterns are given below.
 |  |
|---|
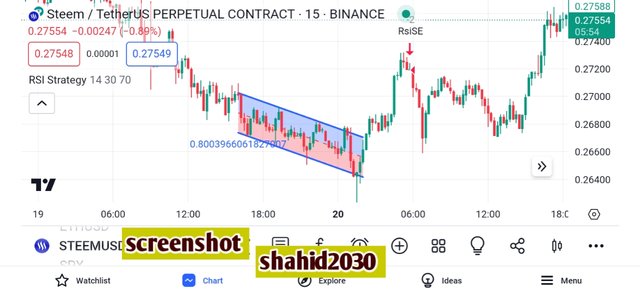
1) Flags and Pennants
We call them the short term patterns and they indicate a brief consolidation before the trend continues in the same direction. Flags have rectangular shape while pennants are small symmetrical triangles.
2) Triangles
There are three types of triangles: Ascending, descending, and symmetrical.
a) Ascending Triangle
Ascending triangles same higher high but it creates a higher low. Ascending triangles mostly give us a break through in upside direction and it is the signal of bullish trend continuation.
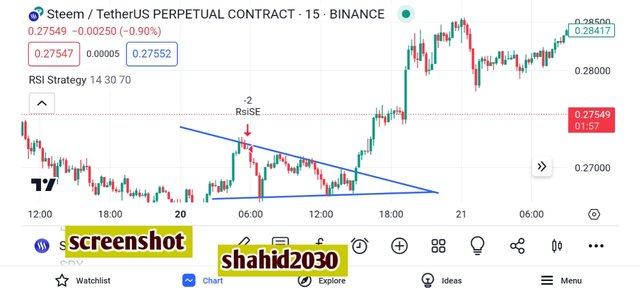
b) Descending Triangle
It has same lower lows but it creates higher Lowes. The price descent gradually. This pattern mostly form when the market is in bearish mood.
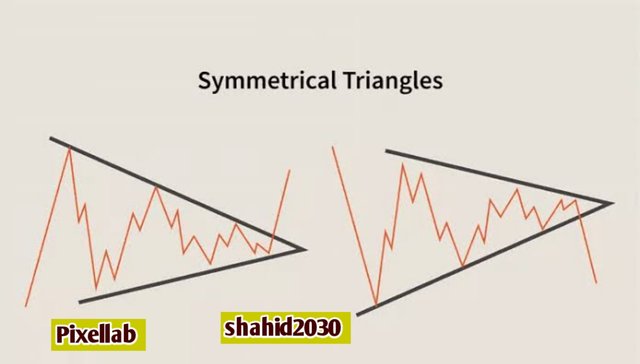
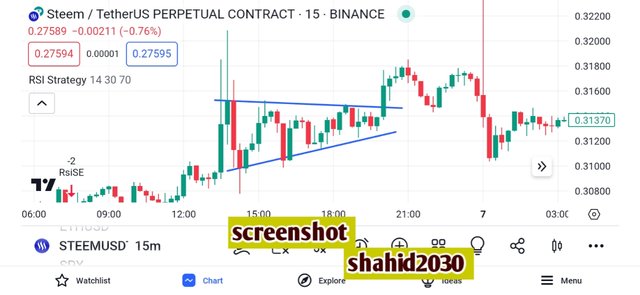
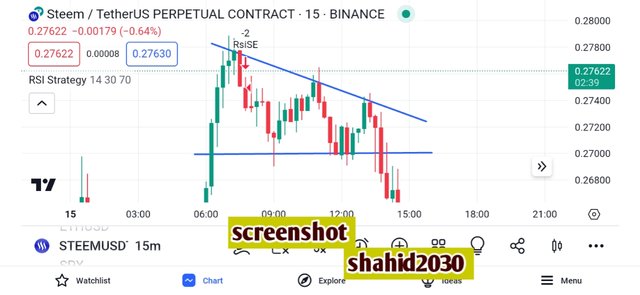
c) Symmetrical triangles
Symmetrical triangles are the same triangles I have mentioned above, but one thing which is different here is, Which ever direction it breaks the market move that direction.
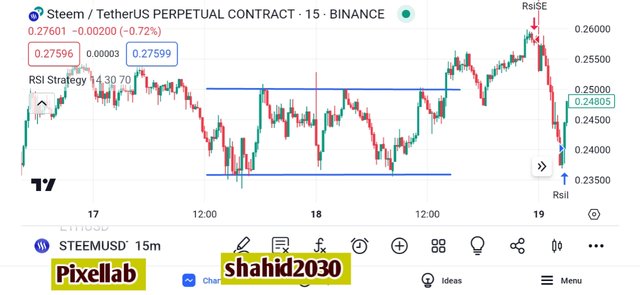
3) Rectangles
This pattern is formed, when the price moves sideways between two horizontal levels of same support and resistance. This shows the market is in consolidation Phase.
Reversal Patterns
Reversal patterns always indicate that the current trend is likely to change direction. It could be for any trend. These patterns signify a shift in the balance of power between buyers and sellers. Some common reversal patterns are explained below.
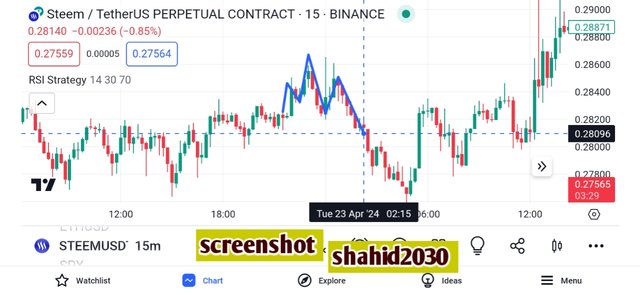
1) Head and Shoulders
This pattern consists of three peaks: a higher peak (head) between two lower peaks (shoulders). It indicates a reversal from a bullish to a bearish trend.
2) Inverse Head and Shoulders
This pattern is opposite to that of head and shoulders pattern. At is formed at the bottom of the chart consist of a lower trough (head) between two higher troughs (shoulders). It shows us a reversal from a bearish to a bullish trend.
3) Double Tops and Bottoms
These two are trend reversal patterns too. A double top is a bearish reversal pattern, which is formed after an uptrend. It is marked by two peaks at roughly the same level.
A double bottom is bullish reversal pattern. It is formed at the bottom having two troughs at roughly the same level. It shows the end of a down trend.
Utilizing Chart Patterns to Set Effective Stop-Loss Orders.
Chart patterns give us the best analysis of the market. They can be effectively used to set stop-loss orders, which help the traders to manage risk and avoid sufficient lost. It automatically close a position when the price reaches a predetermined level. Let's me show the places where we can put effective stoploss.
1) Support and Resistance Levels
Support and Resistance Levels are the two crucial points in technical analysis. Identification of key support and resistance levels within the pattern is important . Then place stop-loss orders just below the support level for long positions or just above the resistance level for short positions.
2) Pattern Breakouts
Set stop-loss orders based on the breakout point of any pattern. For example, a triangle pattern. Place the stop-loss just below the triangle’s lower trendline, if entering a long position on an upward breakout.
3) Percentage-Based Stops
Use a fixed percentage below the entry price as a stop-loss. Must ensure that the percentage stop aligns with key levels identified in the pattern.
What is Trading View and how can it be used to apply technical indicators in real-time trading? Describe the relationship between support and resistance levels and how technical indicators can aid in understanding these concepts. |
|---|
TradingView is a web-based charting platform for traders and investors through out the world. Users utilize it to analyze various financial markets, such as stocks, forex, commodities, and cryptocurrencies, and create trading strategies based on the data they get from their analysis. It offers a wide range of tools for market analysis, including real-time data, customizable charts, and a plethora of technical indicators
Using TradingView for Real-Time Technical Analysis
1) Charting Tools
TradingView provides us advanced charting view, where users can plot price movements over different time frames. These charts give us a complete data of price movement at market. We can use numerous technical indicators and drawing tools to analyze the market here.
2) Technical Indicators
TradingView offers a vast list of technical indicators, such as Moving Averages, Relative Strength Index (RSI), Bollinger Bands, MACD, and more. We can get insights into market trends and potential price movements by using these tools.
Support and Resistance Levels
Support Level
This is a strong demand zone with us. It is a price level where a downtrend is expected to pause due to a increase in concentration of buying interest. It prevent the price from falling further. This is the reason we call it support level, because it gives support to the price.
Resistance Level
Resistance level is opposite to that of Support level in all aspects. It is the strong supply zone, which leads uptrend to pause due to a high concentration of selling interest. It's a level, which prevent the price from rising further.
Relationship Between Technical Indicators and Support/Resistance.
As I have told before Support and Resistance levels are the most key factors in technical analysis. Now let's me mention some valid and authentic indicators that give us best support and resistance levels.
1) Moving Averages
Moving averages can act as dynamic support and resistance levels. We have two most commonly used moving averages, a 50-days moving average and a 200-days moving average. Most of the time we use them in combination and they give us the best support level in an uptrend or resistance in a downtrend.
2) Volume Analysis
We have different types of volume indicators, such as the Volume Profile or On-Balance Volume (OBV), which helps the traders in understanding the strength of support and resistance levels. High volume at a support or resistance level indicates stronger and more reliable levels.
3) RSI and Stochastics
Oscillators like the RSI and Stochastics help us in identification of overbought or oversold conditions. It indicates potential reversal points that align with support or resistance levels.
4) Bollinger Bands
It show us the volatility and potential reversal points in the market. When price touches the upper or lower band, it can indicate resistance or support respectively.
Provide an overview of pivot points and discuss their calculation and significance in trading. Explain how to configure and trade with pivot points, including strategies for pivot point reverse trading. |
|---|
Overview of Pivot Points
Pivot points are technical analysis indicators, which the traders used to identify potential support and resistance levels in the market. These points help the traders to determine the overall market trend and can make trading decisions using it's data. It is particularly used in day trading and short-term strategies.
How to Calculate Pivot Points ?
To Calculate Pivot Points we use standard pivot point formula. It is based on the previous day's high, low, and closing prices. Pivot Point (P) = (High + Low + Close) / 3.
After the pivot point (P) is calculated, the support and resistance levels are derived by using these formulas.
1) First Level of Support (S1) = (2 * Pivot Point) - High
First Level of Resistance (R1) = (2 * Pivot Point) - Low
2) Second Level of Support (S2) = Pivot Point - (High - Low)
Second Level of Resistance (R2) = Pivot Point + (High - Low)
3) Third Level of Support (S3) = Low - 2 * (High - Pivot Point)
Third Level of Resistance (R3) = High + 2 * (Pivot Point - Low)
Significance of Pivot Points in Trading
Indicate Market Sentiment
If the price is above the pivot point, it suggests bullish sentiment. Similarly, if the price is below the pivot point, it indicates bearish sentiment.
Identify Potential Reversal Zones
Pivot points give us the best reversal zones. Traders use it to spot potential reversal zones where the price might change direction
Set Entry and Exit Points
Pivot points help traders to set entry and exit points for their trades.By identifying key levels, pivot points helps in placing stop-loss orders effectively.
This is all about my blog for today, hope you guys have enjoyed reading it. See you soon with a new amazing and interesting topic, till take care.

| I would like to invite: @msharif @cive40, @jasa107, @miyexi, @kouba01, @nathalidelgado, @emsonic, @goodybest, @ripon0630, @beemengine, @tommyl33, @nushrat, @emsonic, @mile16, @pelon53 to participate in this Contest |
|---|
Your presence here means alot
Thanks for being here
Regard shahid2030

Uno de las partes que mas me llamó la atención en este desafío son los puntos de pivote. Este indicador es muy versátil y preciso en el Trading View, desconocía este indicador. Me parece genial, porque facilita el trabajo de interpretación del sentimiento del mercado al mismo tiempo que afianza nuestro acciones y decisiones para operar en un mercado tan volátil minimizando los riesgos.
Gracias por aportar tus conocimientos y compartirlos en tu post.
Saludos y éxitos.
Thank you so much dear for your beautiful comment. Keep blessing.
¡Saludos y buena suerte!
Thank you, friend!


I'm @steem.history, who is steem witness.
Thank you for witnessvoting for me.
please click it!
(Go to https://steemit.com/~witnesses and type fbslo at the bottom of the page)
The weight is reduced because of the lack of Voting Power. If you vote for me as a witness, you can get my little vote.
Upvoted. Thank You for sending some of your rewards to @null. It will make Steem stronger.
!upvote 15
💯⚜2️⃣0️⃣2️⃣4️⃣ Participate in the "Seven Network" Community2️⃣0️⃣2️⃣4️⃣ ⚜💯.
This post was manually selected to be voted on by "Seven Network Project". (Manual Curation of Steem Seven). Also your post was promoted on 🧵"X"🧵 by the account josluds
the post has been upvoted successfully! Remaining bandwidth: 135%
Your post has been rewarded by the Seven Team.
Support partner witnesses
We are the hope!
Greetings friend,
I did learn enough from your entry, especially on the different candlestick patterns, I always trade with using technical indicators as I'm not so skilled in getting these patterns accurately, but then I have learnt a lot from your teachings especially the pivot points indicator too.
I guess Pivot points are like secret codes traders use to find where the market might bounce up or fall back down, this way they help figure out if the market is feeling positive or negative vibes. These points also give hints about where the price might turn around, and they're handy for deciding when to jump in or out of trades. Good luck in the contest friend, all the best.
Thank you so much dear for your so much encouraging words. I will always appreciate that. Keep blessing my friend.
@shahid2030 I appreciate how you've simplified complex concepts like candlestick patterns and support/resistance levels. Your expertise shines through in explaining chart patterns and pivot points. Best of luck in the contest
Thank you so much dear for your beautiful comment. Keep blessing.
Greetings my friend. I really need to dedicate more time to assimilate this subject. Although it is not something extremely difficult is something complex to understand, I'm a little outdated on these issues, however this motivates me more to take back my knowledge in these areas.
I will be more attentive to your post and similar of these topics to participate in crypto.
Greetings and thanks for the invitation.
There are two main protagonists in Dhruv Tara narrative. Tara, a 17th-century princess, and Dhruv, a contemporary surgeon.