Crypto Academy Contest / S20W3: Trading Steem with Fractals and Multi-Timeframe Strategies"
Helloo everyone
S20W3: Trading Steem with Fractals and Multi-Timeframe Strategies

canva editing

Question 1: Explain Market Fractals
Explain what market fractals are and how they can be used to identify trend reversals. Provide an example of a bullish and bearish fractal using a STEEM/USDT trading pair.
Market fractals Are Recurring patterns in financial markets That exhibit self-similarity across Different timeframes. These fractals are Typically used by traders And Analysts to predict Trend Reversals and Continuation patterns Making Them essential Tools for Technical analysis. The term "fractal" itself refers to a Fragmented Geometric Shape that can be split into parts each of which is a Smaller copy of The whole. In Trading Fractals Signal a potential change in market Direction and are often used in combination with other indicators for a more Robust Trading Strategy.
What are Market Fractals?
In the context of trading, fractals are candlestick formations Consisting of five or more bars. They highlight points of market indecision indicating Potential Turning points where the market could reverse Direction. Fractals are typically Categorized as either bullish or Bearish depending on Whether they signal an upward or Downward Market reversal.
A bullish fractal occurs When The market indicates a potential reversal from a Downtrend to an uptrend. This Pattern forms when the middle candlestick has the lowest low flanked by Two Higher lows on either side. Conversely a Bearish fractal suggests a reversal from an uptrend to a downtrend. This Formation occurs when The middle Candlestick has the highest High Surrounded by two lower highs on Both sides.
Fractals are identified on charts by looking for specific price patterns. They are easy to spot visually and are often combined with other Tools like moving averages, Fibonacci Retracements and Momentum indicators to increase accuracy.
How Market Fractals Help Identify Trend Reversals
Fractals help Traders Determine potential points where the Market might change direction. While a single fractal on its own is not Always Sufficient to Confirm a Reversal When used in Conjunction with other Technical analysis Tools it can be a powerful signal.
For instance, traders might combine fractal signals with the use of the Alligator indicator (developed by Bill Williams) to filter out false signals. The Alligator indicator uses Moving averages to show the market trend. When a fractal aligns with the direction Suggested by the Alligators Moving averages The likelihood of a True reversal increases.
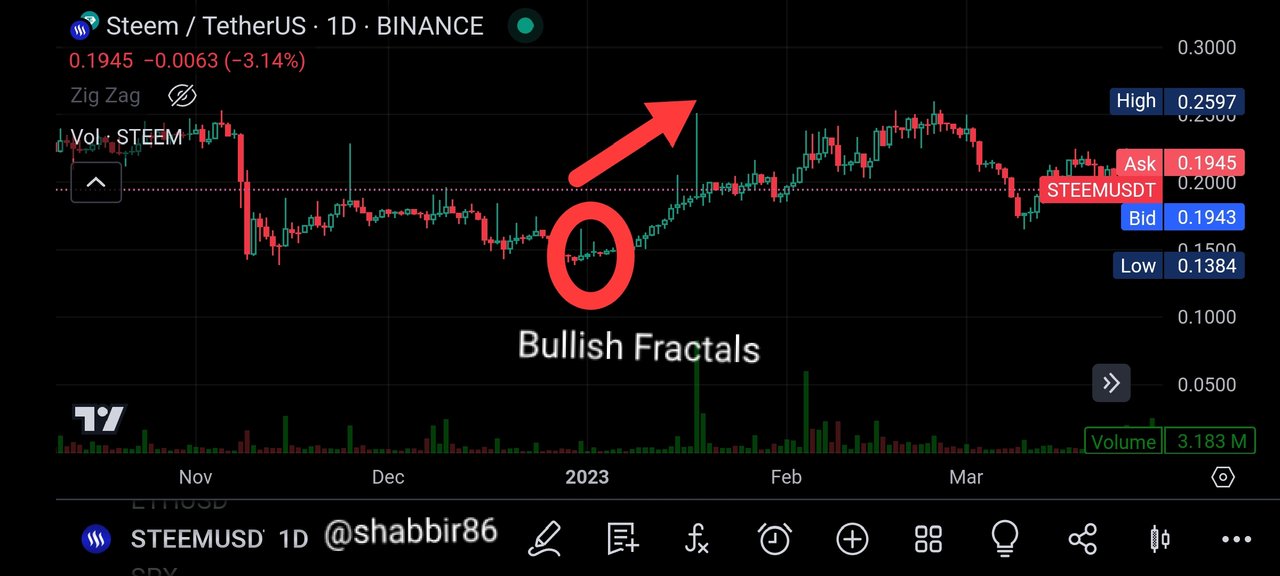
Bullish and Bearish Fractals in the STEEM/USDT Trading Pair
Lets apply these concepts to the STEEM/USDT trading pair to better understand how Market fractals can work in Cryptocurrency Trading.
Bullish Fractal Example
In a bearish Market The STEEM/USDT pair could display a bullish fractal when a low is followed by Two Higher lows on either side of the central candlestick. This pattern Signals that selling pressure is weakening and That a reversal may be imminent. Once Confirmed by other indicators like RSI (Relative Strength Index) Showing oversold conditions, a Trader might consider entering a long position Betting That the market will turn upward.
Bearish Fractal Example
On the flip side, a bearish fractal might form when STEEM/USDT is in an uptrend. In this case The highest high is flanked by two lower Highs suggesting That buying momentum is fading and a Reversal could occur. Combined with other Bearish signals such as a Declining MACD (Moving Average Convergence Divergence) or resistance from a Fibonacci level Traders might consider shorting the pair in anticipation of a downward Reversal.

over all
Market fractals are valuable tools for identifying potential trend reversals in financial Markets including the STEEM/USDT trading pair. By recognizing And interpreting these Recurring patterns Traders can enhance Their Technical Analysis And make more informed Trading Decisions. However it is crucial To Combine fractals with other indicators To minimize the risk of false signals and improve trading accuracy.
Question 2: Combine Fractals with Other Indicators
Discuss how fractals can be combined with other technical indicators like the RSI, moving averages, or Alligator to improve trend predictions. Show a practical example of using these tools together on a Steem chart.
Fractals are a useful Technical indicator in the Financial Markets identifying Potential Reversal points in The price Action of an asset. However fractals alone may not provide a complete picture of Market conditions. To improve the Accuracy of Trend Predictions fractals can be Combined with other Technical indicators like the Relative Strength Index (RSI), Moving Averages (MA) or the Alligator indicator. Each of these Tools adds a layer of confirmation to trading Decisions helping Traders avoid false signals And Better identify trends.
1. Combining Fractals with RSI
The Relative Strength Index (RSI) is a Momentum, Oscillator That Measures The Speed and Change, of price Movements. It Ranges fFrom 0 to 100 With Levels Above 70 indicating an Overbought Condition, And levels below 30 Signaling oversold Conditions. When used Alongside fractals RSI can Help Confirm Whether a Reversal is likely to occur.
For example if a Fractal appears indicating a potential market Top (bearish Fractal) and the RSI is above 70 This can confirm the likelihood of a price reversal. Conversely if a Bullish Fractal forms at a market bottom and the RSI is below 30 this may suggest an upward price Movement is imminent.
On a Steem Chart if a Bearish fractal forms near the Overbought level of the RSI a trader might Take it as a Signal to sell or short The asset expecting a price drop.
2. Fractals with Moving Averages
Moving Averages, (MAs) are Another popular Tool used to identify The Direction, of The trend. There are Two common, types: The Simple Moving Average (SMA) and the Exponential Moving Average (EMA). MAs smooth out price data, making it easier to spot trends over a Specific period.

By combining Fractals with moving averages, Traders can confirm the direction of the trend. For instance when a bullish fractal forms and the price is Above the 50-day SMA or EMA it could signal the continuation of an uptrend. On The other hand if a bearish fractal forms and the price is Below the 50-day moving Average it can signal a Potential downtrend.
In a Steem Chart if a Bullish Fractal forms and the Price is above the 200-day EMA a Trader might take this as a Confirmation to buy expecting the trend to continue upward.
3. Fractals with the Alligator Indicator
The Alligator indicator created by Bill Williams Consists of three smoothed Moving averages: the jaw (blue line), teeth (red line) And lips (green line). This indicator helps traders identify the market's Direction Timing of entry Points and potential price Targets. When combined with Fractals the Alligator indicator can Help Confirm trend strength.

For instance if a Bullish fractal forms while the Alligators jaw Teeth and lips Are aligned and trending upwards, this can signal the beginning of a Strong uptrend. Conversely a Bearish Fractal combined with a downward-facing Alligator indicator can confirm a potential downtrend.

In Practice on a Steem Chart if a bearish fractal appears while the Alligator's three lines are Fanned out in a downward direction a Trader may interpret This as a signal to Sell or exit long positions.
Conclusion
By Combining fractals with RSI Moving Averages, or the Alligator indicator Traders can enhance Their Trend predictions and avoid false signals. While fractals Mark potential Reversals other indicators add confirmation to The trend Direction giving Traders more confidence in Their decisions. On a Steem chart using these tools together can provide a More Reliable And comprehensive Strategy for navigating Market trends.
Question 3: Using Fractals Across Multiple Time Frames
Show how fractals can be used on different time frames (daily, weekly, or even hourly charts). Identify fractals on a daily and weekly Steem chart and explain how they interact to provide a comprehensive market outlook.
Using Fractals Across Multiple Time Frames on Steem Charts
Fractals are a Common Technical analysis tool used by traders to identify potential turning Points in The Market. Fractals represent recurring patterns that can indicate reversals in Price trends. They consist of a series of five or more bars, Where the highest high or lowest low in the series is considered the Fractal point. Understanding fractals across multiple time Frames Such as daily And weekly Charts can help traders make informed Decisions about Market Trends Particularly in a volatile Market like Steem.
Fractals on the Daily Steem Chart
On a daily Steem chart fractals can be useful for short-term trading decisions. Each fractal high or low forms When the price experiences a peak or Trough indicating potential reversals. These patterns can help identify The short-term trend direction—whether the market is likely to move upwards or Downwards.

For instance a bullish fractal forms when the middle Candlestick has a lower high than the Two candles before and after it. This signals a potential upward move. Conversely a bearish fractal indicates that the Market might turn downward when the middle Candlestick has a Higher high than the adjacent candles.
In the case of Steem identifying These fractal points on a daily chart could Reveal short-term Reversals that allow traders to enter or exit Positions at opportune Moments. For Example if a trader identifies a Bullish Fractal on The daily chart they Might take it as a signal to buy Steem anticipating a rise in Price.
Fractals on the Weekly Steem Chart
Weekly charts provide a Broader perspective on the market and are More suited to long-term trading Strategies. Fractals on Weekly Charts tend to represent more Significant reversals and Trends as they are based on larger Market Movements.

For Steem a Bullish fractal 1D on the Weekly chart might suggest a long-term upward trend Potentially Signaling The beginning of a Prolonged bull run. Likewise a Bearish fractal on a weekly chart Can indicate a Market Downturn Prompting Traders to consider Selling or Shorting positions.

The Advantage of using Weekly fractals is That they filter out much of The noise found in Shorter Time frames Making Them a more Reliable Tool for Traders looking for long-term trend reversals.
Interaction Between Daily and Weekly Fractals
When Using fractals Across multiple Time1D frames Traders can gain a more Comprehensive view of the Market. For Example, if a trader spots a Bullish fractal on the daily chart but sees a Bearish fractal on the Weekly Chart they might interpret this as a short-term upward move Within a longer-term downtrend. In Contrast if both The daily And Weekly Charts exhibit Bullish Fractals this Could be a Strong signal to enter a long Position as both Short- and long-term trends align.
In the case of Steem aligning Fractals across Different time frames provides Traders with Deeper insight into the Markets direction. By monitoring these fractals across both daily and weekly Charts Traders can Optimize their trading strategies And Manage Risk more Effectively.
Conclusion
Using fractals on Both daily and weekly Steem charts allows Traders to view Market movements from both short- and long-term Perspectives. While daily Fractals Help Capture Short-term Fluctuations Weekly Fractals offer insights into broader Market trends. By analyzing how these fractals interact Across time Frames traders can better Understand the market outlook and Make more informed Trading decisions.
Question 4: Develop a Trading Strategy Based on Fractals
Create a complete trading strategy using fractals for the Steem token. Specify entry and exit points, stop-loss levels, and use recent fractals on a chart to support your strategy.
Fractals are recurring patterns that appear in price charts, signaling Potential reversals in the market. In the context of Technical analysis, a fractal is formed by a sequence of five or More consecutive price bars where the middle bar has the highest high (in a Bullish fractal) or the lowest low (in a bearish fractal). When applied Correctly fractals can help Traders identify entry and exit points in a trading Strategy. This guide provides a fractal-based trading strategy for the Steem Token focusing on identifying Profitable Trade Setups while minimizing risk.
1. Fractal Identification
To develop a Trading strategy based on fractals, The first Step is to Understand how to spot them:
Bullish Fractal: This forms when There is a series of five or More price bars Where the middle bar has the Highest high, And The Two bars on Each side have lower highs. This indicates a Potential upward reversal.
Bearish Fractal: This forms when the middle bar has the lowest low With two Higher lows on either side, signaling a possible Downward reversal.
For the Steem token Fractals can be identified on timeframes ranging from 15 Minutes for intraday tTrading to daily charts for longer-term positions. Its important to combine fractals with other Technical indicators, such as Moving averages or the Relative Strength Index (RSI), to filter out false signals.
2. Entry Points
Bullish Entry: When a Bullish Fractal appears, consider entering a buy position after Confirmation from Another technical indicator. For example, if the RSI is below 30 (indicating an oversold condition), this could add Weight to the buy signal. Alternatively if The price is Above a short-term moving average (e.g., 50-period MA), it signals potential upward momentum.
Bearish Entry: Similarly when a bearish fractal is identified Consider entering a sell position. A confirmed sell signal could occur when the RSI is above 70 (indicating overbought conditions) or when The price is below a key Moving average.

3. Exit Points
Bullish Fractal Exit: For a buy Position exit when a Bearish fractal forms indicating a Potential Market reversal. Another exit Strategy could be Trailing The stop-loss below recent swing lows.
Bearish Fractal Exit: In a sell Position exit when a bullish Fractal appears. Alternatively a trailing stop-loss can be placed Above recent Swing highs.
4. Stop-Loss Levels
Using fractals can Help set logical Stop-loss levels:
For a bullish Trade place the stop-loss below the lowest point of The identified bullish fractal. This Provides a clear risk level and prevents getting caught in market volatility.
For a bearish Trade place The stop-loss above the highest Point of the bearish Fractal.
5. Example Using Recent Steem Chart
Suppose a Bullish fractal appeared on the Steem 4-hour Chart with the price bouncing off a key support level. After Confirmation with the 50-period Moving Average, a Buy position can be opened. The stop-loss is set just Below The fractal low, And the exit occurs When a Bearish fractal or a major Resistance zone is reached.
By Using fractals in Combination with other Technical Tools Traders can Effectively build a Trading Strategy for the Steem Token improving The Timing of entries and exits while Minimizing risk.
Question 5: Analyze Steem’s Current Market Trend with Fractals
Analyze Steem’s current market position using fractals. Where do you think the Steem token is in its fractal cycle (bullish or bearish)? What are the next possible moves? Support your analysis with other indicators such as RSI or moving averages.
Analysis of Steem's Current Market Trend with Fractals
Steem, a Blockchain-based platform designed for social media and content monetization, has Garnered attention in the crypto space for its innovative reward structure. To analyze Steem’s current market position, Utilizing fractal Analysis provides a deeper understanding of its cyclical patterns. Fractals, in technical analysis, help identify recurring price patterns within market movements, which can offer clues about the potential direction of an asset.

Current Fractal Cycle: Bullish or Bearish?
At present, Steem appears to be in a bearish fractal cycle. Historically, Steem exhibits significant price Swings following distinct Fractal formations. In the last few months, the price has exhibited signs of a downward Trend resembling past bearish fractals Where The asset Went through sharp Corrections before Bottoming out and later starting another bullish cycle. This is corroborated by patterns of lower highs and lower lows in recent Price Action which are indicative of a bearish fractal in motion.
However, it is Worth noting That after such corrections, assets often consolidate before showing signs of a reversal. Steem may currently be in the latter stage of this bearish fractal, as there are indicators of slowing downward Momentum Suggesting a potential reversal or Consolidation phase could be imminent.
RSI (Relative Strength Index) and Moving Averages
To support the fractal analysis, RSI (Relative Strength Index) is a key indicator. In recent weeks, Steem is RSI has dipped below 30, signaling that the token may be in oversold territory. Such levels Typically suggest that sellers have Exhausted Themselves And a reversal might be near. This Could indicate that The Bearish fractal cycle is approaching its end, and the Market could soon transition into a more Bullish phase.
Additionally the moving averages (MAs) offer insight into the broader trend. Steem is price has been Trading below the 50-day moving average, which is a bearish Signal. Furthermore a Potential death cross (where the 50-day MA crosses below the 200-day MA) Could confirm the continuation of a bearish trend. However should Steem begin to trade above these moving averages especially the 50-day, it could Signal a bullish Reversal and the Start of a new fractal cycle.
Possible Next Moves
Given the fractal And Technical analysis, there are two possible scenarios. If the Bearish fractal completes and a Bullish reversal follows, we could see Steem break key resistance levels with initial Targets Around the 50-day MA. On the flip side if selling pressure Continues Steem might Test lower Support levels before Finding a bottom.
In Conclusion Steem Appears to be in the late stages of a bearish fractal With indicators like RSI suggesting a potential reversal.
I Would like to invite @patjewell @suboohi @josepha to take part in this contest
Cc, Professor @kouba01
Thanks for stop in my Blog
I appreciate how you have broken down the concept of bullish and bearish fractals and how they can be applied to the STEEM/USDT trading pair. The example you gave using the Alligator indicator to filter signals adds a lot of practical value for traders looking to improve their strategy. Combining fractals with other indicators like RSI and Moving Averages certainly enhances accuracy in trend prediction.
Good luck
Thanks for your valuable comment with detail
Your analysis is really deep and thoughtful through fractal and multi-timeframe strategies. This type of technique is highly effective for successful trading. Good luck for the contest.
There is no doubt that we are looking for a detailed trading strategy using fractals and multi-time frame analysis. The post highlights the importance of using Fractals in Combination with technical indicators such as RSI, moving averages, and Alligator indicators for better Trading predictions.
Fractals serve as essential tools for identifying potential trend Changes and when combined with other Tools They can significantly increase trading accuracy. The post uses the STEEM/USDT trading pair as an example to illustrate bullish and bearish fractal patterns.
Thank you very much for reading this post deeply and giving your valuable time to it and hope you also get success.👍🌟
X Permotion Twitter
https://twitter.com/shabbir_saghar/status/1840107806629745133?t=ddWujZQ2DDbn2UzDTORnow&s=19
Upvoted! Thank you for supporting witness @jswit.
@josepha Thanks for your support