Steemit Crypto Academy | Season 3- Week 3 | Introduction to Technical Analysis of Price Patterns
I am writing this post in response to the assignment task given by the professor @imagen , I really enjoyed your class and really appreciate and thankful to you for your work for the steemit community.
.jpg)
- Which platform did you choose and why?
Now a days there are lots of centralized and decentralized platform where we can stake our coins but i love Pancakeswap Decentralized Platform to trade/swap and stake .
Pancakeswap is a very popular decentralized exchange which is built on Binance Smart Chain . It allows us to trade /swap , staking , farming etc. on it's platform . Binance smart chain is very fast , low transaction fees and secure . I choose pancakeswap because it is decentralised, easy to use, low transaction fees because of the binance smart chain. From mobile we can use and trade which is very easy and registration, verification etc. not required.
The most important thing for me to love and use this platform because it is safe and secure , faster, provides lots of other features, lots of coins available and very low transaction fees.
Here i am going to show how we can Stake our coins in Pancakeswap https://pancakeswap.finance/
To use pancakeswap we need a wallet which supports Decentralized Applications and Binance Smart Chain. I use TRUST WALLET which supports all Decentralised applications and Decentralized exchanges and Binance Smart Chain as well. Trust wallet is available for All mobile devices ( Andoid and IOS) . You can download it from Play store and App store and also from their official website https://trustwallet.com/
Connect Trust wallet to PancakeSwap :
.jpg)
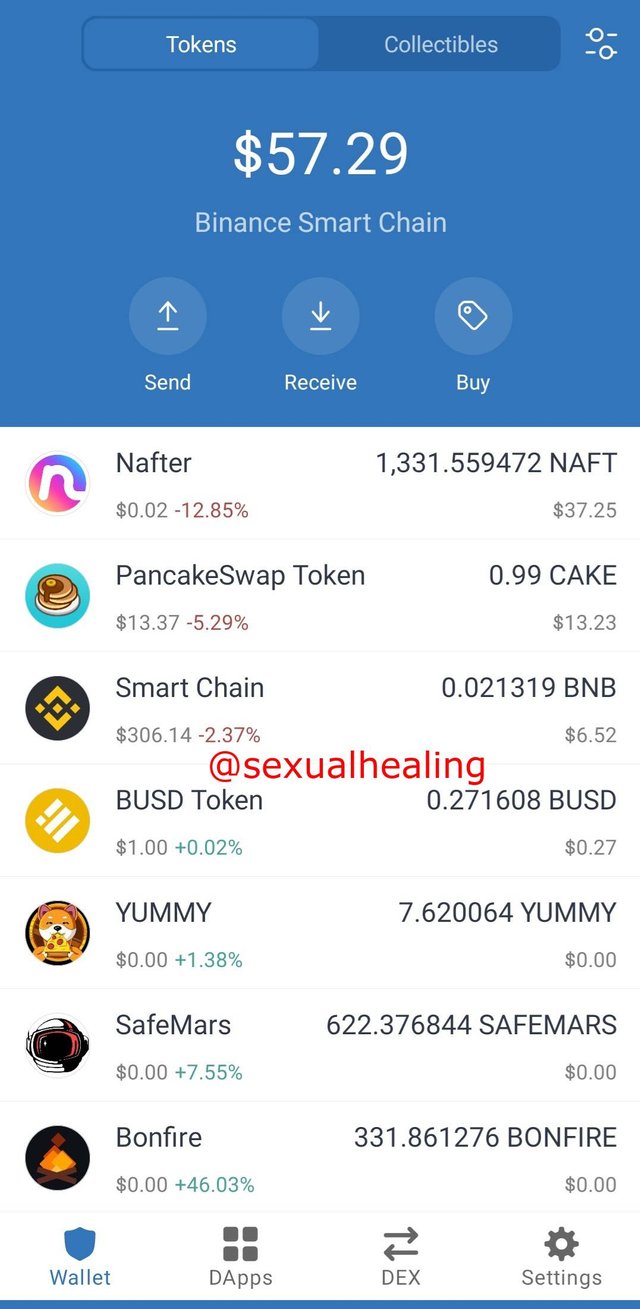
- Open Trust Wallet : You can see this is the Trust wallet interface ( make sure you have already setup your trust wallet and kept your passphrase seed words safely)
%20(1).jpg)
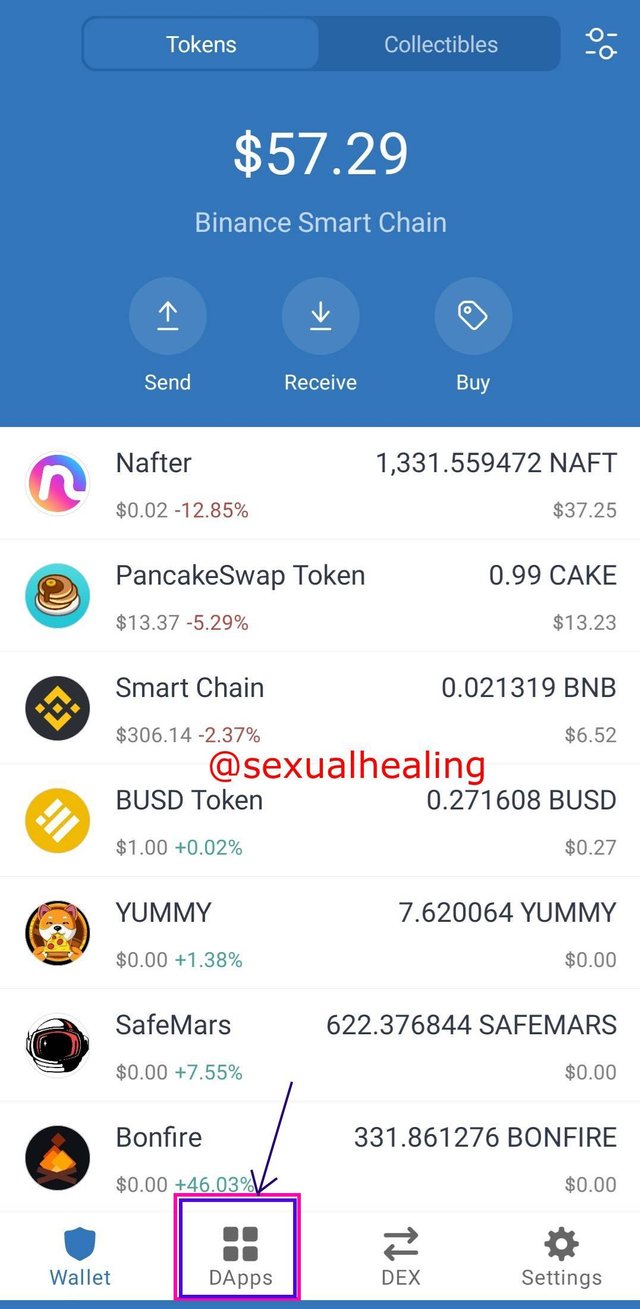
- Tap on Dapps . Dapps means Decentralized Applications :
.jpg)
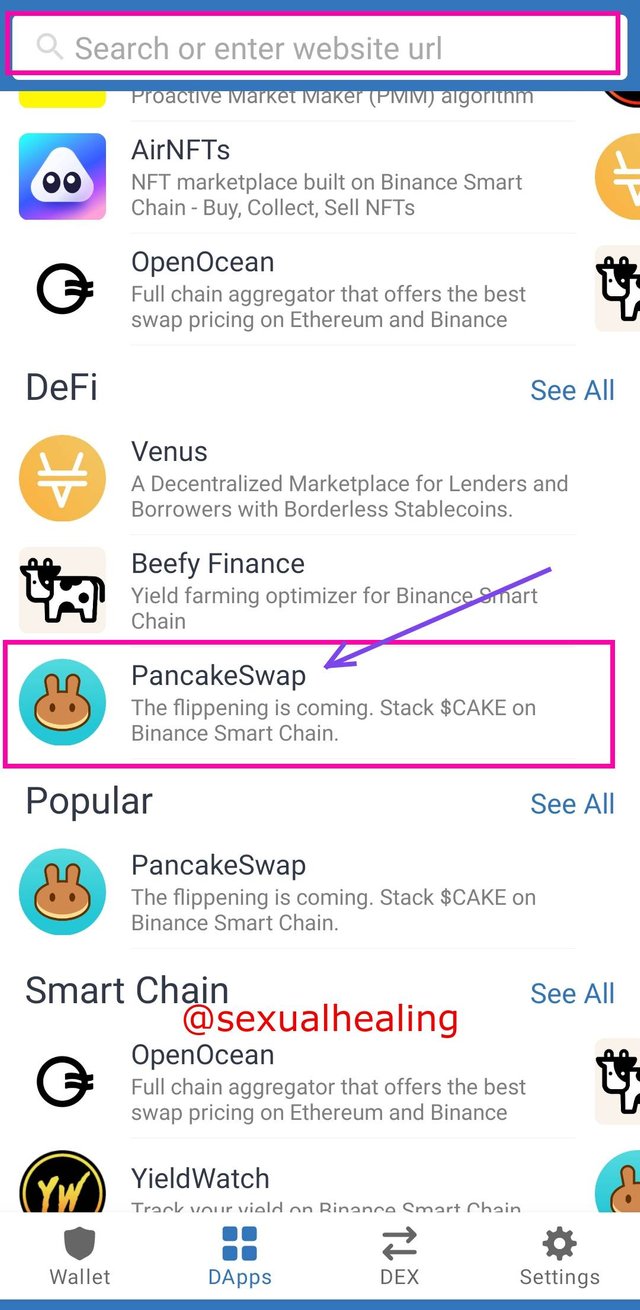
- In Defi Option you can see PancakeSwap , Click on it to open PancakeSwap Dex . you can also visit Pancankeswap dex by entering url into the url or search box on the top :
.jpg)
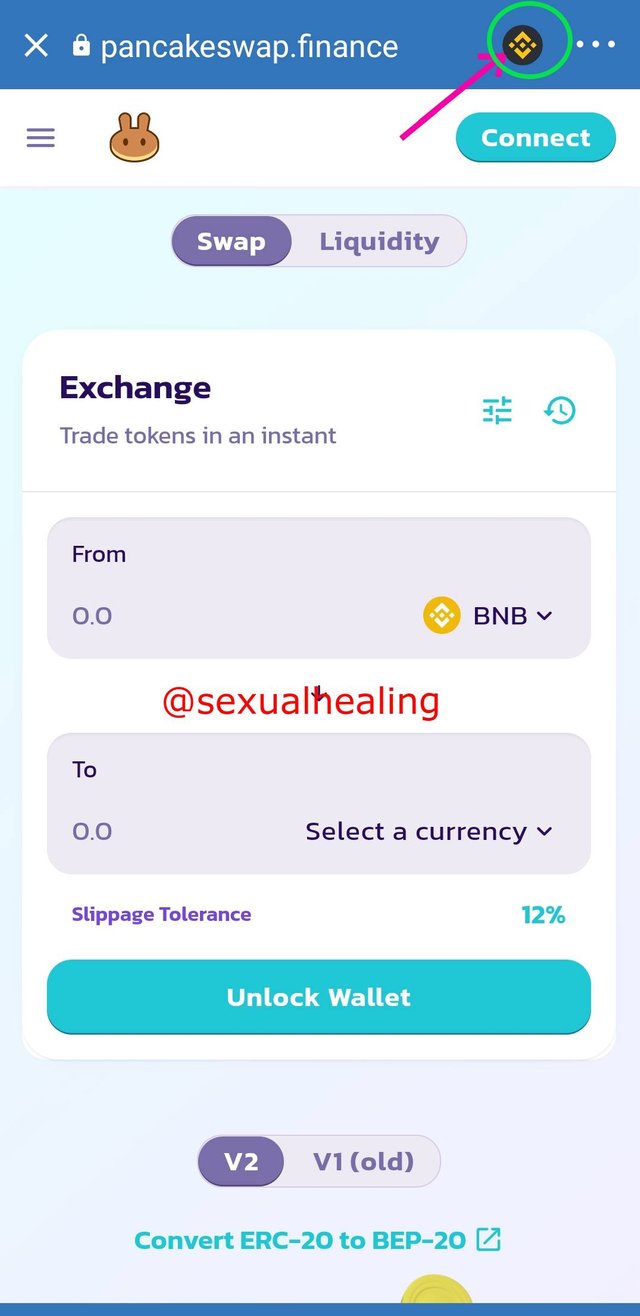
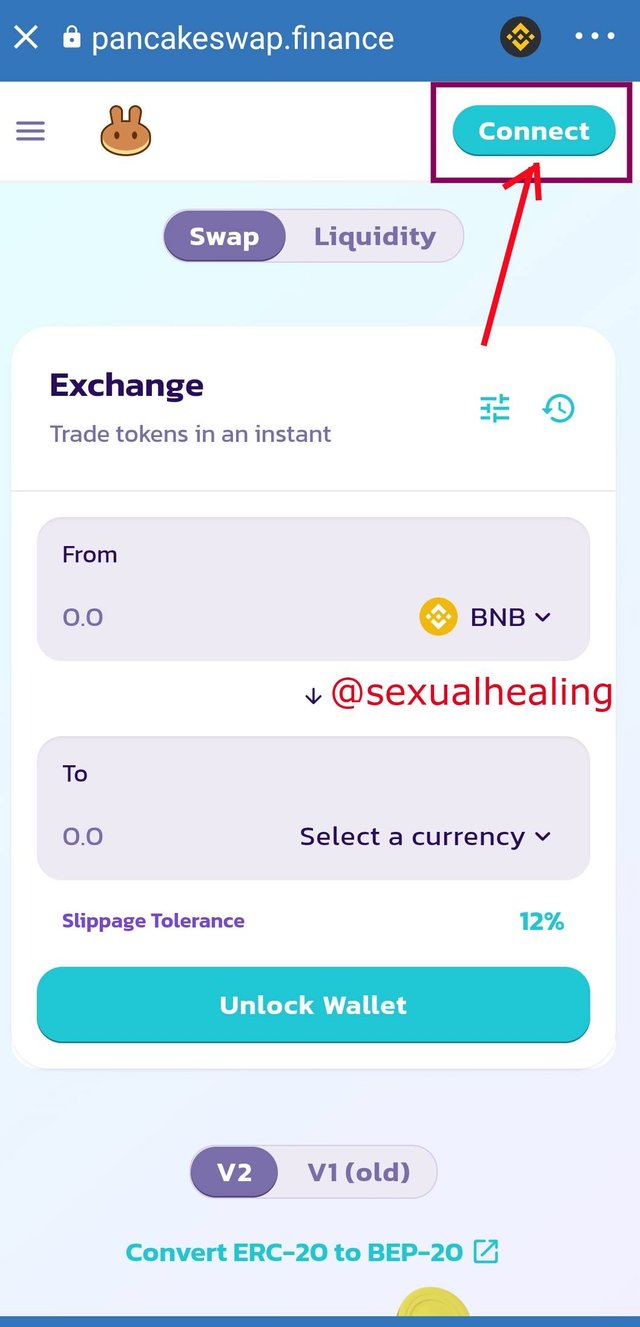
- This is the Pancakeswap Dex's Interface, the chain will be automatically selected as Binance Smart Chain, If any other chain is selected then change it to Smart Chain :
.jpg)
- Now click on Connect to connect your trust wallet to PancakeSwap:
.jpg)
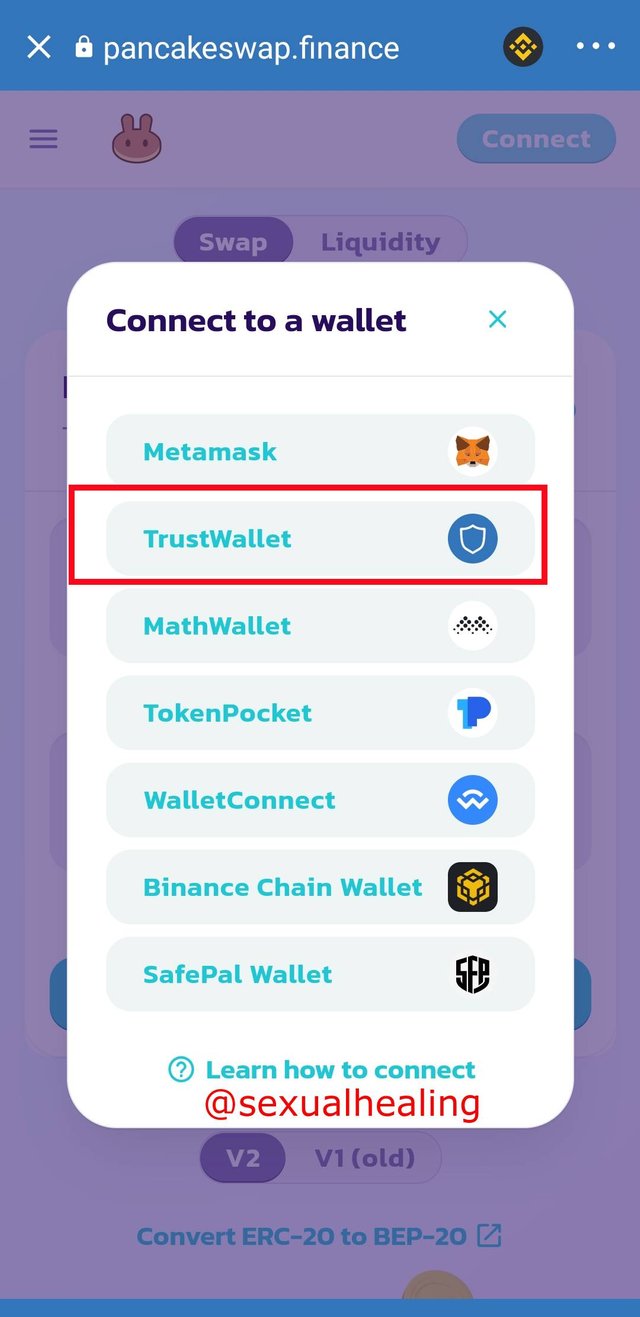
- When you click on Connect , it shows you list of wallets , click on Trust Wallet :
.jpg)
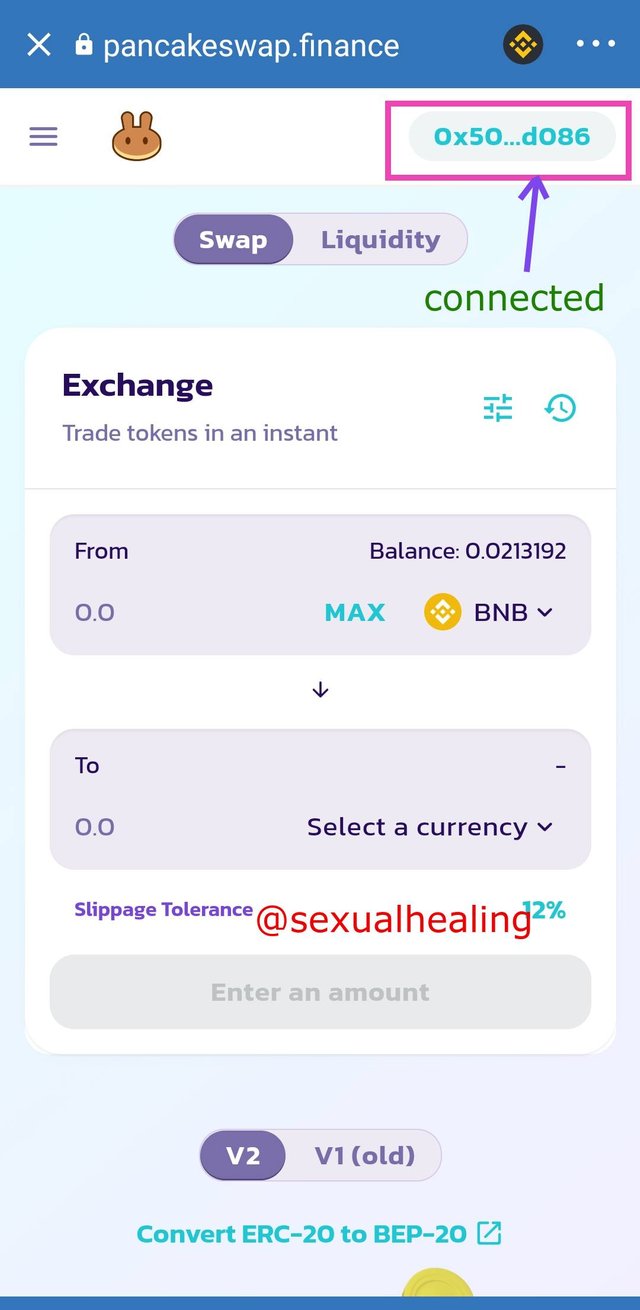
- Now you can see my wallet has been connected to the Pancakeswap, Now i can perform all the task in Pancakeswap like swap/trade, staking, farming, buying lottery etc.
Staking :
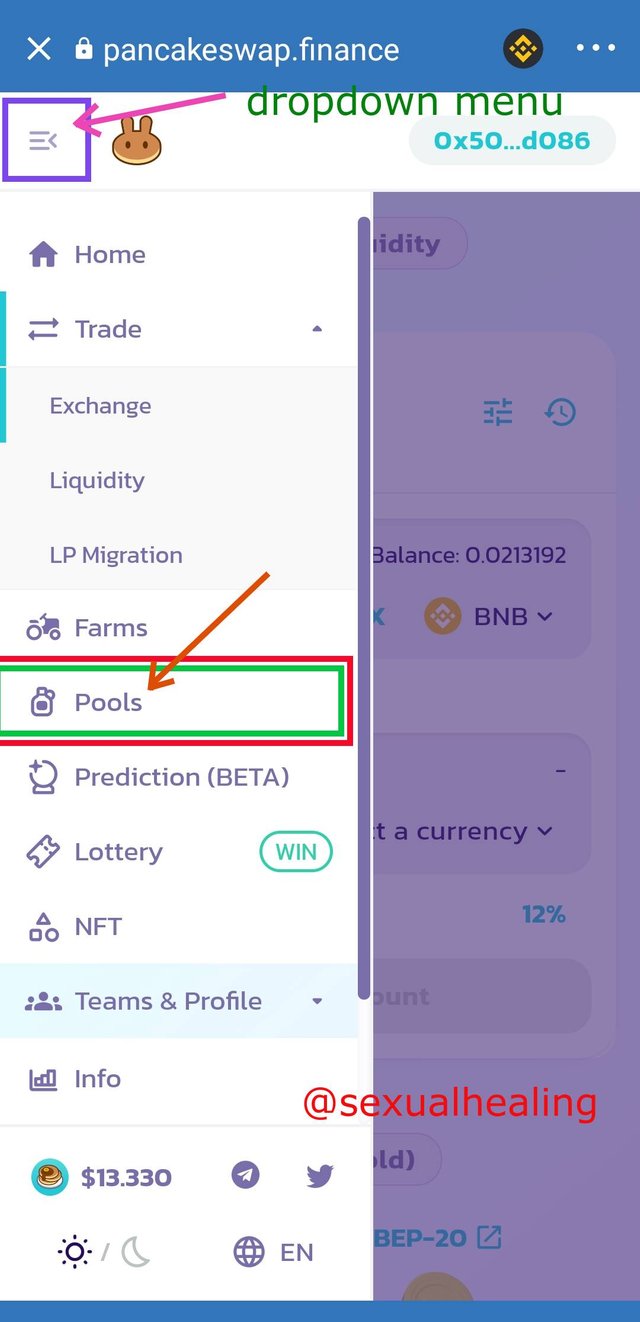
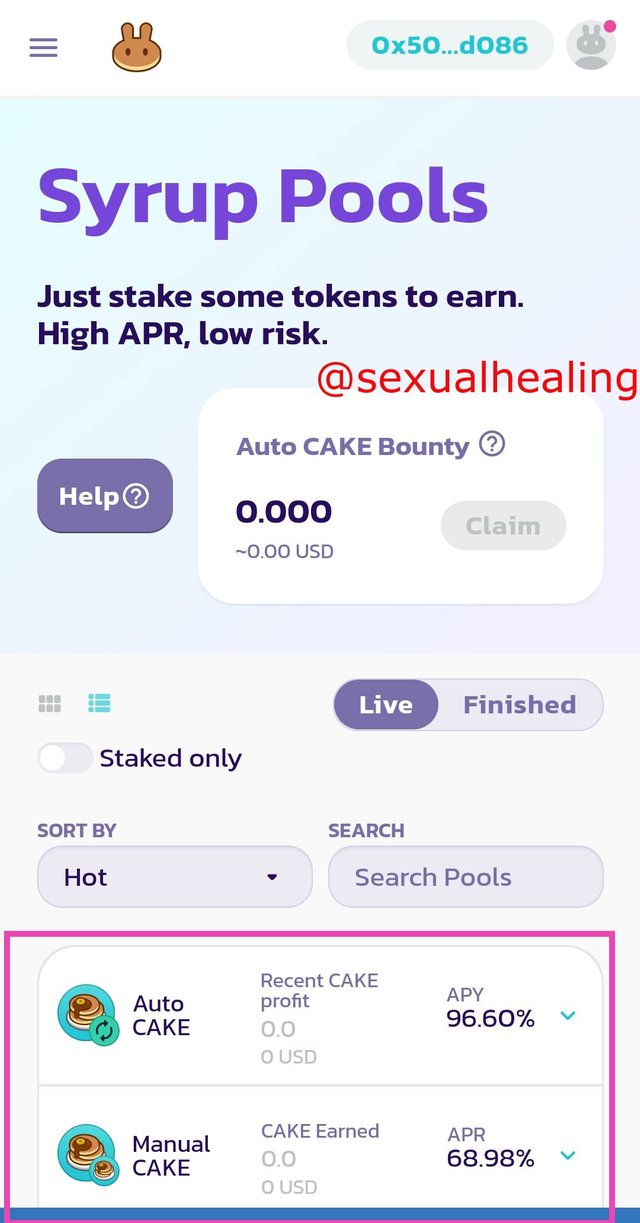
- To stake into the PancakeSwap click on Dropdown Menu on the left corner on top . Now you can see lots of options . Click on Pools
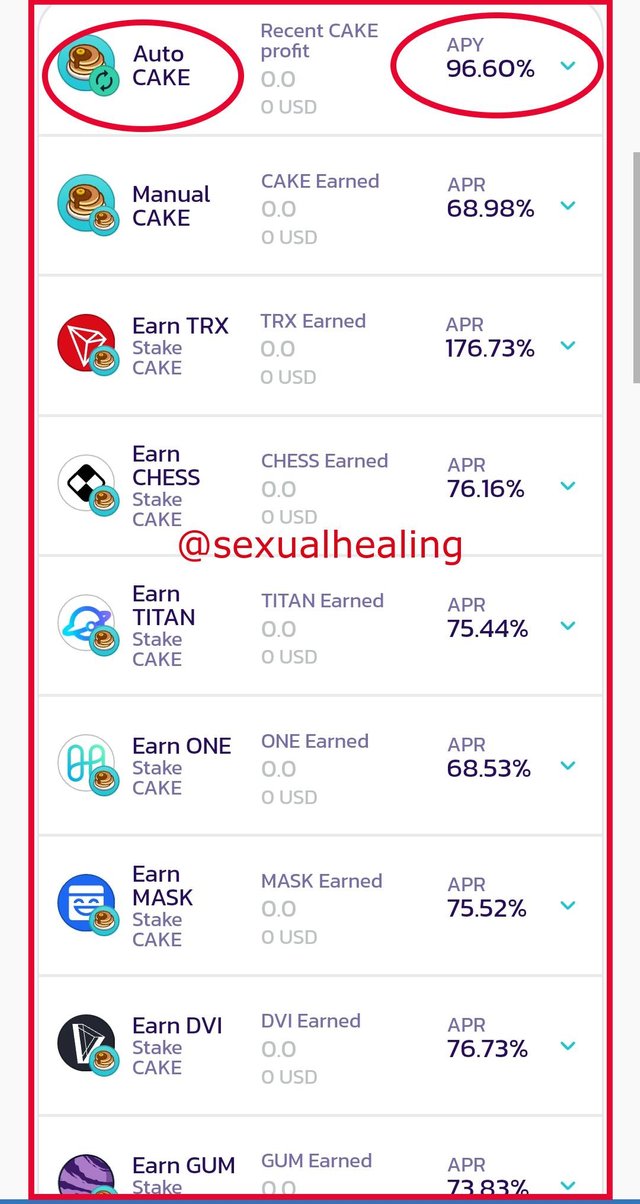
- Now we can see there are lots of staking pools are available where you can stake different coins in related pool . We can also see the APY returns for the related pool , as i have Cake coin in my wallet to stake in Pancakeswap , i will choose Cake pool . Currently the APY on Cake auto is 96.60% which is we can say very close to 100% . It means yearly 100% return as per current pool size .
.jpg)
.jpg)
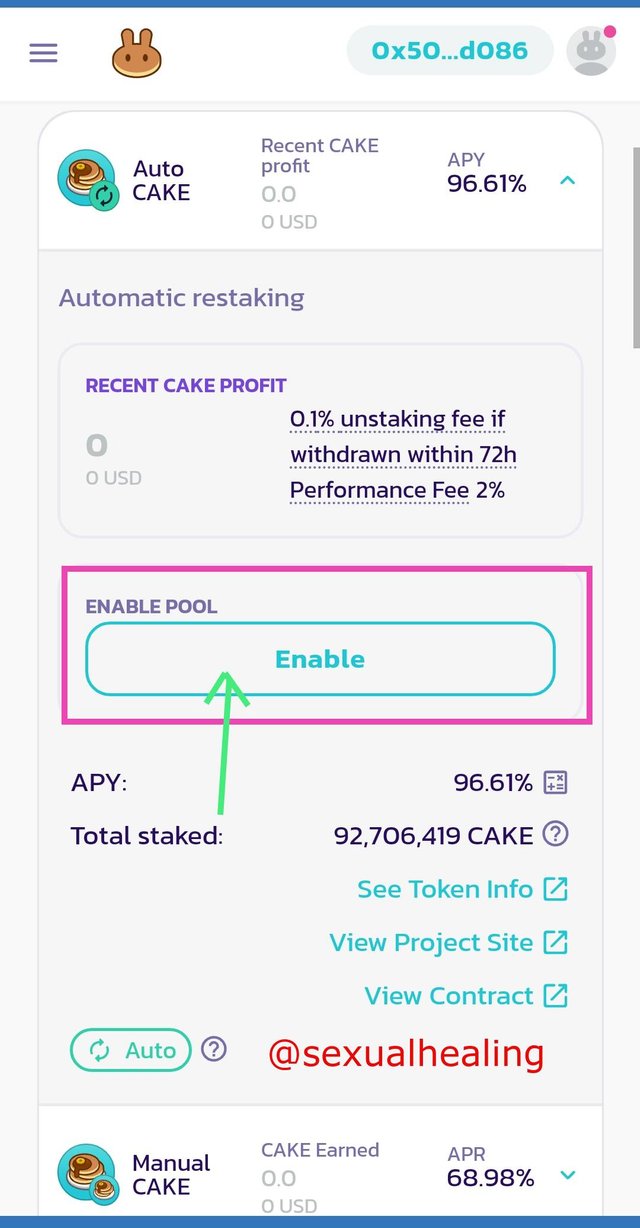
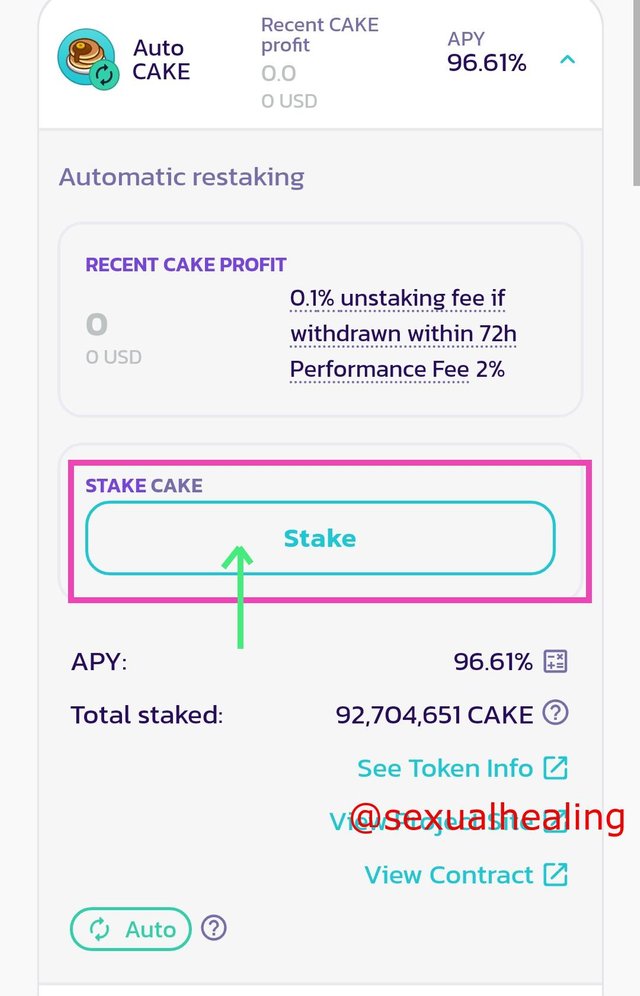
- Now click on Enable and Stake option will appear. Click on Stake to stake your available coins in the related pool. In my case , i have Cake Token which i am going to stake in Cake Pool .
.jpg)
.jpg)
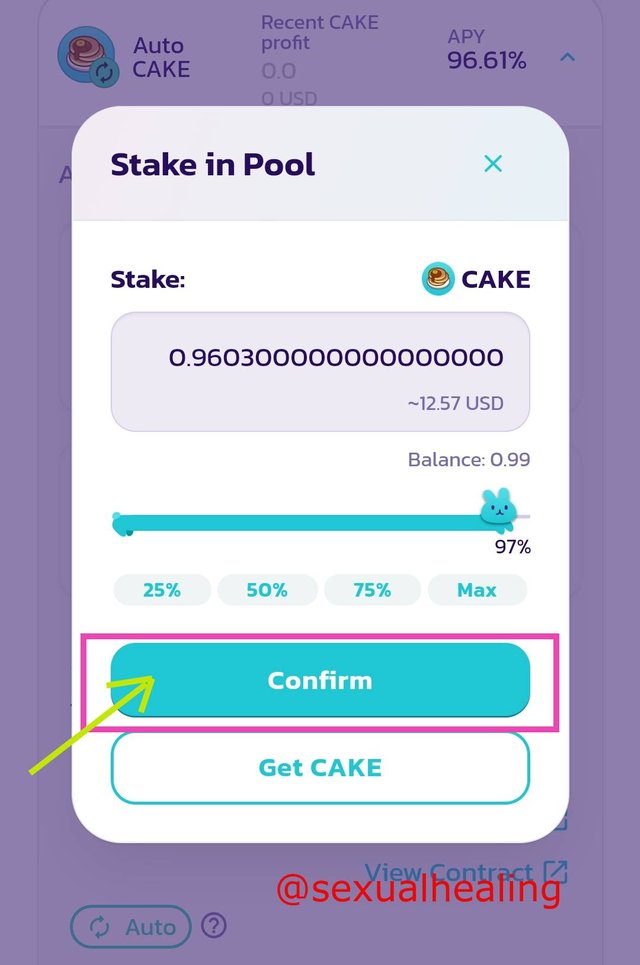
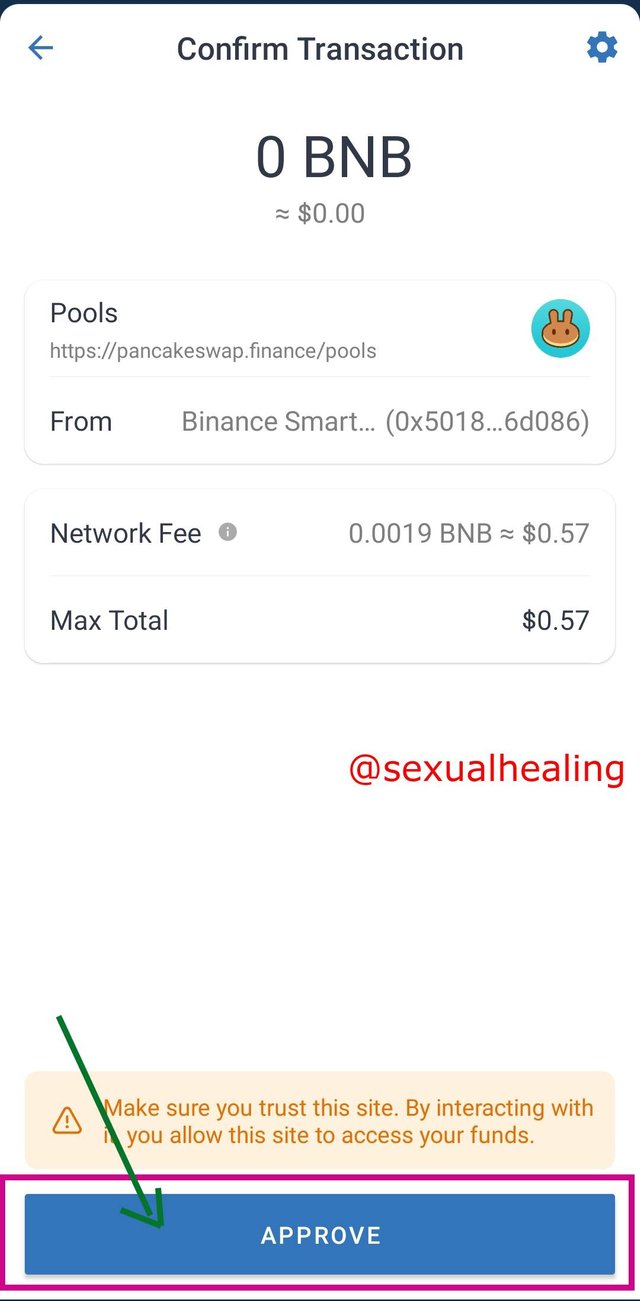
- Now choose how much quantity of your token you want to stake and click on Confirm button. Now a popup will appear for the confirmation of the transaction. Click on Approve . Now your stake will be approved and will reflet in PancakeSwap
.jpg)
.jpg)
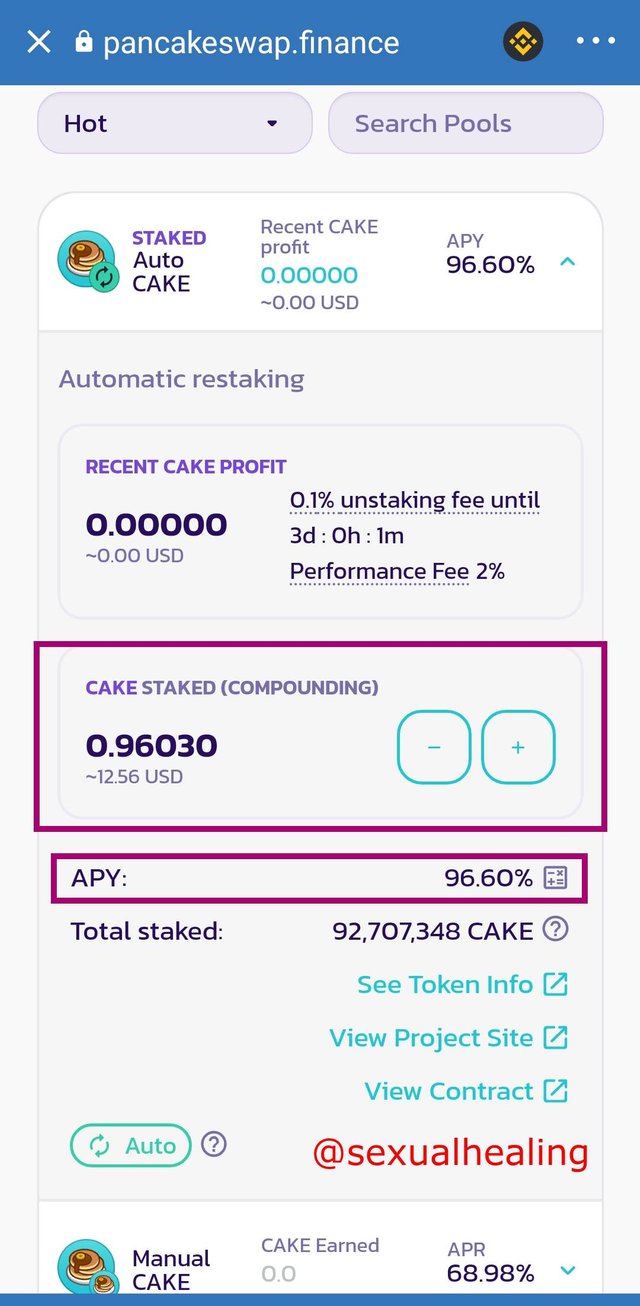
- Now Finally we can see i have successfully staked my 0.99 CAKE token into the PancakeSwap and excluding fees it is showing 0.96 Cake staked with APY of 96.60% which is really a very good APY

3 coins that i have chosen for technical analysis are : Bitcoin , Ethereum and Cake .
- Technical Analysis of Bitcoin in 7 days time frame :
.jpg)
Image Source: https://www.tradingview.com/
As we can see on the chart the price was respecting the trendline and price of the bitcoin was continuously rising , it was in uptrend for long weeks . after hitting the price of $65,000 level it started moving inside channel for few weeks. And suddenly the price crashed to $32,000 area breaking the channel and previous support of $42,000 level. For many weeks the price is moving between $31,000 to $35,000 . Chart is not looking bullish and there is higher chance that the price will crash towards downside to the $20,000 level if this support of $30,000 is broken. Market sentiment is not bullish and technically also the chances are high for the price crash from current price range.
- Technical Analysis of Bitcoin in 30 days (Monthly) time frame :
.jpg)
Image Source: https://www.tradingview.com/
As we can see on the chart the price was respecting the trend line and price of the bitcoin was moving into symmetrical triangle for many months and we can say it was accumulation . And finally the price broke out upside the triangle and price shoot up . It was in continuous uptrend for about 6 months . But finally price crashed due to the fundamental negative news and price hit $31,000 level. The crash was huge and formed a very large red candle and still the price is moving in $31,000 to $35,000 price range . There is higher probability that the price will fall downside as there in there is no good volume or momentum in the market . If the price breaks from current levels, i can see the price might hit $20,000 level of previous support.
If BTC holds the current position and pump upside then 1st possible target will be around $42,000 price range.
- Technical Analysis of Ethereum in 7 days timeframe :
.jpg)
Image Source: https://www.tradingview.com/
We can see on the chart that the price started rising from accumulation and finally brokeout symmetrical trianmgle pattern and price moved towards upside continuously . But after 2 big green candle price crashed and very big fall in price was seen. Price hit high of around $4400 and the low is $1850 in sharp fall. Now price is moving in the same zone and making a ascending triangle pattern. Mostly prices fall from ascending triangle . Another possible factor of downward breakout is low movement in price movement and traders are in fear because of different FUDs in the market .
There is higher probability that the price of ethereum will fall down towards previous support at around $1200 .
- Technical Analysis of Ethereum in 30 days (monthly) timeframe :
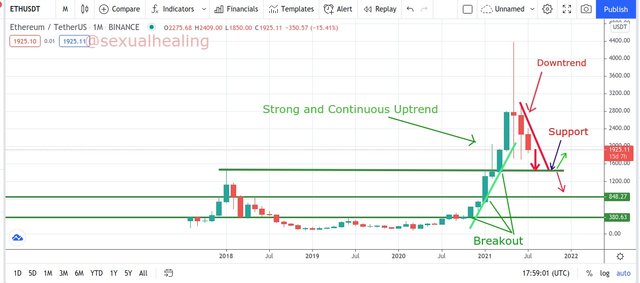
Image Source: https://www.tradingview.com/
Above we can see after accumulation phase price broke up initial resistance and keep going up. Finally after breaking the major resistance of $800-850 price moved up very well and broken the previous important price level of $1450 . Price continuously rose upside and price hit top of $4400 . But from there the price started crashing and we can see there price crashed very badly and formed a very bearish monthly candle. Hit down price of $1850 during the crash. After the major crash , downtrend started and still price is going downward continuously .
Now most probably the price will fall more and touch previous support of $1450 area. The price should reverse and go upside from that area . If price holds support and go upside then we may see good uptrend again but if the price breaks the support then possible next support area will be at around $850 area. For short term price might fall more .
Currently the price movement is downward.
- Technical Analysis of Cake in 7 days timeframe :
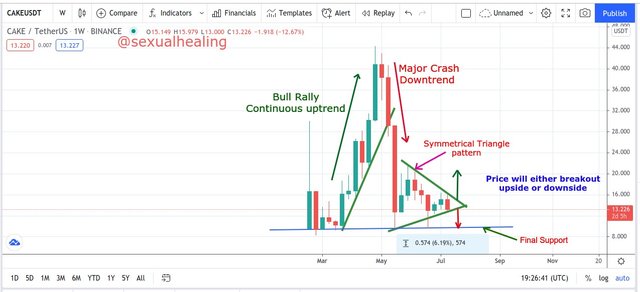
Image Source: https://www.tradingview.com/
Price started moving upside from the support at around $10 , price kept rising breaking all previous cancle and making higher high . For few weeks it was in bull rally and we can see continuous rise in price. The top high it touched marek of $44. But after hitting $44 mark price started crashing hard . It took 6 weeks to hit the high price but crashed and hit the previous initial support in 3 weekly candles.
Currently we can see price is moving in the range of symmetrical triangle pattern at the price range of $12-$14 . There are 2 probabilities either the candle will breakout upside or it may breakout towards downside till it's initial support of around $10. There is higher chance that the price will fall and test the initial support and then price may bounce back toward upside.
Currently the price movement is downward.
- Technical Analysis of Cake in 30 days (monthly) time frame :
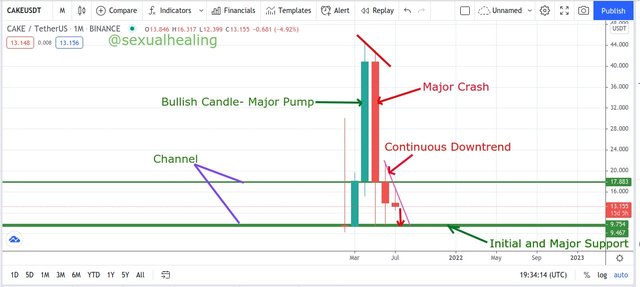
Image Source: https://www.tradingview.com/
Well there is not much data available of Cake in monthly time frame because the coin is not old. We can see that one very big green candle in monthly time frame but the next monthly candle is big red candle which indicates the major crash and price sharply fell down to the level where the price was pumped before. Now price is continuously going downside and moving inside the channel . There is high probability that the price will touch the mark of around $9.75 which is a major support.
Bull Season : Bull season means the rise of price in continuous uptrend making higher high and breaking previous resistance. In Bull session we can see large green candles and price keep rising. Bull season is lead by positive market sentiments which includes FOMO, Developmental and Fundamental news etc. , Positive news regarding related assets , their developments and adaptation etc. Apart from these , there are lots of other factors which is responsible for Bull season.
Bear Season : Bear season means continuous fall in price making lower low and breaking previous support. In Bear season we can see continuous fall in price and large red candles . Bear season is lead by negative market sentiments which includes FUDs, Negative Developmental and Fundamental news etc. , Negative news regarding related assets , their developments and adaptation, Hacking, Ban etc. Apart from these , there are lots of other factors which is responsible for Bull season.
From the below chart we can understand and differentiate between Bull Market and Bear Market :
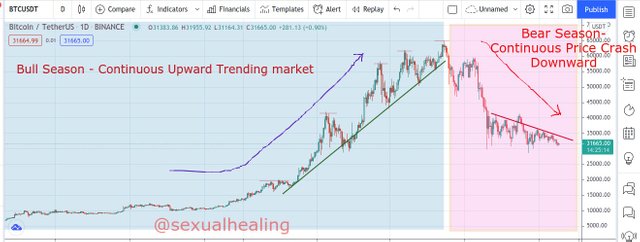
Image Source: https://www.tradingview.com/
We can see there was no bigger movements in the price of BTC:USD initially and it was moving in sideways and market was moving in accumulation phase, after accumulation phase we can see big rise in price . Price consistently moved towards upside and reached all time high of around $65,000 . It took 6 months of time to reach the all time high mark. Market was in continuous uptrend . But After hitting $65,000 mark price started crashing due to the bad fundamental news and since then the bear season started and price is continuously falling . Now there is high probability that the price might fall till the $20,000 mark. Market is still in Bearish Trend.
Staking is a good way to earn and accumulate more coins , it also helps to average out the buying price in bear market. We should always consider good and safe platform while staking. Now a days there are lots of scamming or unaudited projects in the markets which shows higher APY returns Which can be very risky for you guys . Always choose trustful platform for staking your assets.
Both Technical and Fundamental Analysis are very important in all financial markets and helps us to determine the current and upcoming probable market condition . But one thing we should keep in mind that no tools or technique give 100% accurate results . We shouldn't completely rely only on Fundamental and Technical analysis. All the financial markets specially crypto market is very risky so only invest what you can afford to loose. And yes i consider trading in trending market and currently the btc market is in continuous bear season.
Thank you for participating in the Third Season of the Steemit Crypto Academy.
You made a great effort, however, in the assignment, it was requested to show the amount of coins staked at the end of the year and its equivalent in USD, and in your post I don't see the answer. On the other hand, in Question # 2 the analyzes should be carried out for periods of time of 7 and 30 days respectively and not on historical data with compressed lapses.
Continue to strive, I look forward to continuing to correct your next assignments.
I will definately try to improve and focus on my post more ! thank you professor !