Crypto Academy Week 10 - Homework Post for Professor @stream4u - All About Price Forecasting
Background image
Introduction
Today I will make a homework assignment from my learning at steemit crypto academy, here I will make an assignment given by professor @stream4u, All About Price Forecasting.
Here the professor gives his assignment, the assignment includes 4 points, including:
- What Is Price Forecasting?
- Discuss on why Price Forecasting is needed?
- What Methods are best you feel for Price Prediction/Forecasting.
- Take any Crypto Asset Chart graph and explain how to do Price Forecasting? OR Take any Crypto Assets Chart graph & as per its current price tell us what will be its future price for next 1 week or 1 month? You can predict for any direction up or down but explain it properly on what basis you have predicted the price.
Source
Oke, without prolonging preamble, I invite you to jump right into my homework assignment. Stay tuned and read to the end, OK :)
1. Price Forecasting
From what I understand, according to most of the general understanding of the thinking of many people in society, what is meant by forecasting is an prediction of events that will occur in the future or events that will come in the next day, This of course has a basis that we must see, the basics of forecasting activities are seeing information from past events by relating it to the present.
In simpler language, forecasting is something that we must guess in the future, and when the forecast is related to cryptocurrency then of course the forecast must have initial data first, the data can be seen through the price chart on the coin we want to predict.
So what is meant by forecasting is something that we must guess in the future, and when the forecast is related to cryptocurrency then of course the forecast must have initial data first, this data can be seen through the price chart on the coin that we want to predict in the future. Of course, forecasting aims to estimate future profits.
2. Price Forecasting Required
Okay sir, now that we know the meaning of forecasting let's discuss the purpose of forecasting, as well as why price forecasting should be done. As I discussed in the meaning of forecasting, which is to find out future events, I can conclude that forecasting is needed so that we get profits and minimize potential losses, in this case it is related to trading activities on coins crypto currency.
Forecasting also aims so that we can consider and prepare for something that will happen in the future against a coin that we want to predict. It also aims to help us so that unwanted events occur in the future, this unwanted event is a loss, in this discussion I take an example, suppose you buy a coin called AAA on the market for $ 1 and you buy it without any consideration, of course it is not effective in a buying activity.
So the conclusion is that forecasting is important for planning in making a decision so as to minimize losses and provide positive potential or we call it profit in a crypto currency purchase.
3. Price Forecasting Method
As the professor said in his lecture, price forecasting can be done in 3 ways, namely by:
- Technical Analysis
- Fundamental Analysis
- Sentimental Analysis
From the understanding that the professor explained about the 3 ways of analysis, it seems that I am more interested in Technical Analysis. Why ? Because trading has to look at volume, now when we talk about data for the last 3 years where I see data on the lowest price movement to the highest or from the highest to the lowest price in one month, it reaches 150 million Rupiah, which can be said that this rains is very far, and certain traders should be able to take advantage of this.
As I write this article it suddenly reminds me of the recent coronavirus pandemic, that someone is stockpiling masks in the hope of selling them at a high price in the future, given the potential need for masks itself is very important in our lives today. But in this I disagree because when you do that, of course you have no ethics, I can say that because I work in a hospital and lack masks.
Okay, let's return to the core discussion of this lecture, technical analysis is actually very necessary, why is that? because price movements must be armed with a simple statistical basis called technical analysis.
4. Technical Analysis (Prediction/Forecasting)
Okay crypto friends, greetings before I start the discussion on task number four, I want to say that the first thing that must be done to carry out a trading activity is that you must first have a chart like the one in my post below. And the chart that I took here is on Indodax, with the main topic BTC-IDR
Now if crypto friends don't know what the terms of these forms are, then I invite you to get to know them first, the first thing you should know is that in the image above is a chart of price movements, and these price movements can be adjusted using several The options on the graph screen, for example, you want to use, graph on bars, candles, hollow candles, lines, areas, or heikin ashi.
| Style | Graph/Chart |
|---|---|
| Candles | 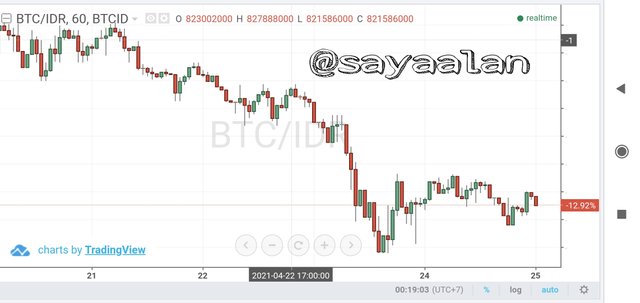 |
| Bars | 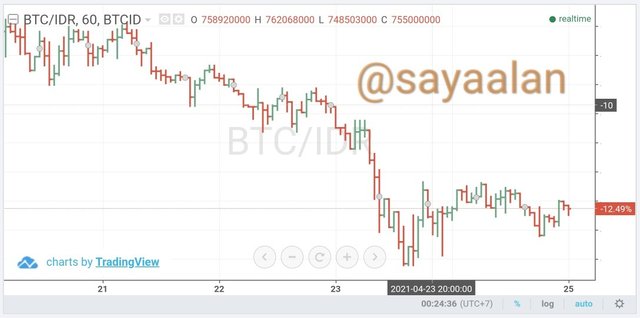 |
| Line | 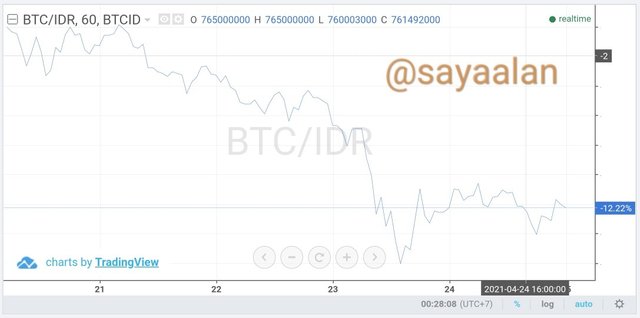 |
| Area | 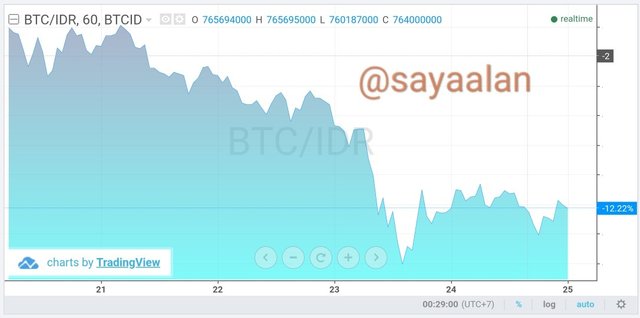 |
| Heikin Ashi | 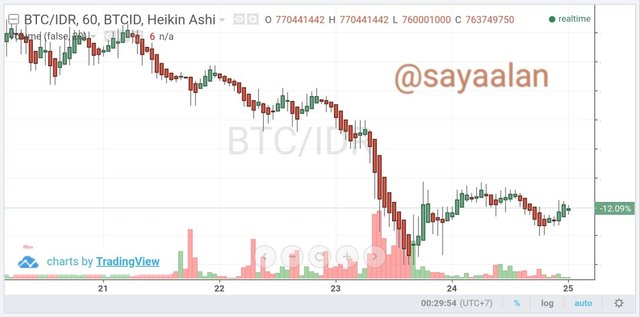 |
| Hollow Candle | 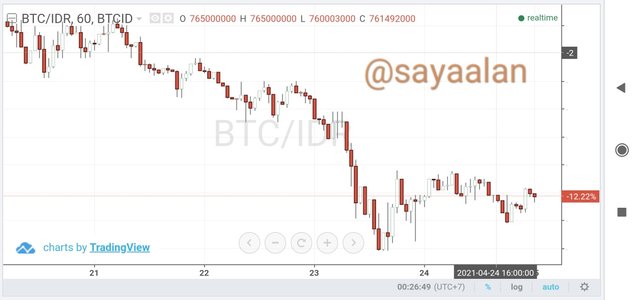 |
Now what will usually be the direct differentiator between this graph is the line and the candle, why is that? My answer is on the graph on line, only a little information is obtained, only the price can be seen, that's all, even though as we know, the price on the chart represents per 60 minutes, not only silent, but moving from time to time. .
Given also that bitcoin is one of the cryptocurrencies with the highest transaction volume and also the largest market cap until the time I wrote this article.
Actually Bitcoin is not just standing still, now where can we find out? the answer is in graph on candles, okay let's look again at the same time as in the graph on line image above, namely Bitcoin at 00.00 WIB.
So here I invite you to see 765694000 is support from 60 minutes, why can I say that? because, 764599000 is the closing of the last 60 minutes on the candle, Well here maybe a friend will ask, then what is the function I know about this, the answer is because for people who use technical analysis, that is someone who analyzes in detail, in one candle it gives a lot of meaning.
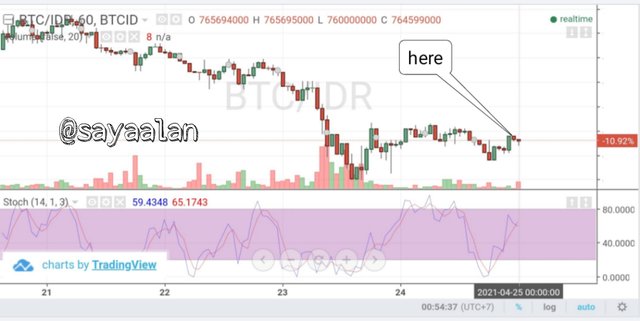
Then this is something that we read, where one candle from before, what we can see is; this thing goes up from one high point and tries to go up to the highest point again, and turns out to be unable to end up being depressed, and this usually makes something called a potential reversal, this is what a trader reads.
It means that if it is able to pass the highest point from now on then I can say that this will strengthen and be sustainable, because the strong support between open and close cannot be maintained and goes down, then this is usually called a support break, and it will weaken.
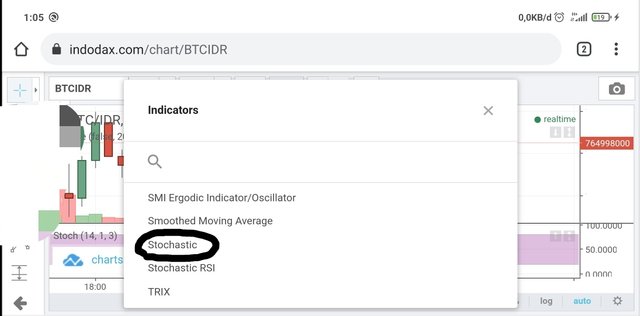
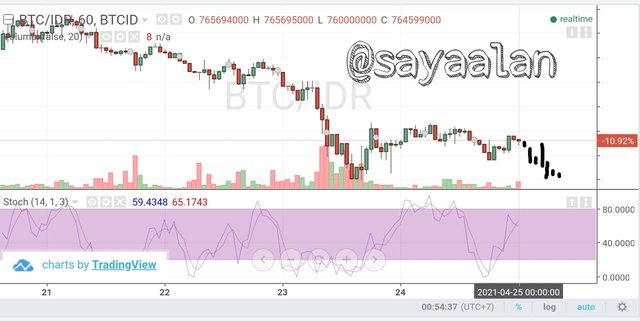
Here I will also help you to better understand what is called stochastic, if you find that the price goes up and the volume is in the area above the stochastic, then the stochastic that is above 80% is called market saturation, usually in this condition the coin will go down for some time. time later for the next 2 weeks.
Conclusion
- You can find out why people often use technical analysis because it is very important to read the market situation, read price movements, and candle sticks are a basic help for you to start predicting future prices.
- We must also concentrate on market volume, thereby minimizing losses and providing a greater potential for profit.
- You also need to know that there are candle formations that you can learn more about in addition to my writing.
- And this is the most important thing in my opinion, you have to keep following the trend, the point is that the trend is not the same between 60 minutes and the trend for 1 day, you have to pay attention to the difference between the two
- Here I also want to say that if you are new to trading and want to try it, you must dare to stop losing or sell at a loss, and take it back, so that you don't lose too much, that's just a suggestion, not an appeal that you have to do.
I know that if you want to learn trading today, everything I say in this article will be confusing, so here I advise you to read my writings over and over again about this point number. Hopefully my writing is useful and make sure when you want to trade you have to think first, and consider with full consideration.
Support source :
Professor @stream4u, this is my Homework assignment on "Steemit Crypto Academy | Course By @stream4u - All About Price Forecasting".

Share on twitter
Hi @sayaalan
Thank you for joining The Steemit Crypto Academy Courses and participated in the Week 10 Homework Task.
Your Week 10 Homework Task verification has been done by @Stream4u, hope you have enjoyed and learned something new.
Thank You.
@stream4u
Crypto Professors : Steemit Crypto Academy
Thank u very much professor @stream4u