Steemit cryptoacademy homework task for @fendit | Wyckoff's method
Hey steemians
In this post i will be submitting my homework task for @fendit on topic: Wyckoff's method.
The Wyckoff method is a method used in technical analysis to keep track of the trends of an asset.
Using Wyckoff's method one can :
(1) Pick an asset that can make one a profit.
(2) One can enter the market at an advantageous point and can get an asset at a low price.
(3) One can tolerate all the risks of facing a loss while trading, by positioning stop loss according to the trend of the market.
(4) One can make a long and short trade position by identifying or predicting the price of an asset.
This method was developed by Richard Wyckoff in the early 1930s, he was one of the greatest markets forecasters and traders of his time, he shares the same fame and glory in the world of stocks as Elliot, Jesse Livermore, J.P. Morgan and many other famous technical analysts or traders.
His research and study about the trend and market gave rise to many other theories and techniques that can be used in trading.
In this task, the concepts or techniques I will be writing about are :
(1) Composite Man
(2) Three fundamental laws of Wyckoff's method.

Composite Man
Richard Wyckoff made it easy for traders to study the market trends.
He coined a term called Composite Man, he told traders to think of the market as it is being controlled by a single entity(Composite Man).
So, by keeping tracks of the moves made by that single entity, traders can study the trend of the market and act accordingly.
Note: You can think of Composite Man as an influential or affluent man who can control the market by any means.
You can take Elon musk as an example of a Composite Man, as he can control the market by just tweeting about any of the cryptocurrencies he wants.
He can influence a cryptocurrency in both ways positively and negatively.
How Composite Man influence or control the market in a market cycle
In this section, I will be telling the strategy of a Composite Man in a market cycle.
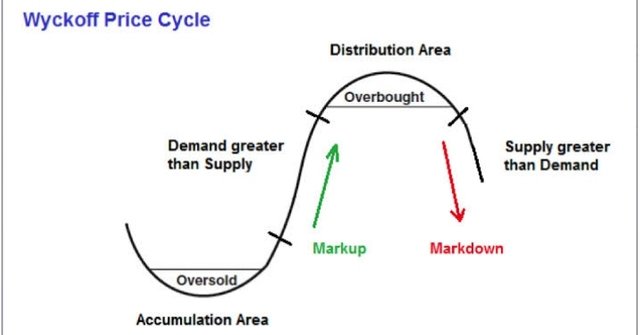
A market cycle contains four phases :
(1) Accumulation
(2) An uptrend(Markup)
(3) Distribution
(4) A downtrend(Mardown)
(1) Accumulation
In this step of a market cycle, Composite Man started gathering the asset before other investors enter the market or buy an asset, Composite man gathers an asset constantly but slowly so that there wouldn't be any surge in the price of the asset.
The sole purpose of gathering the assets is to limit the supply of that asset and to increase the demand for the asset in the market.
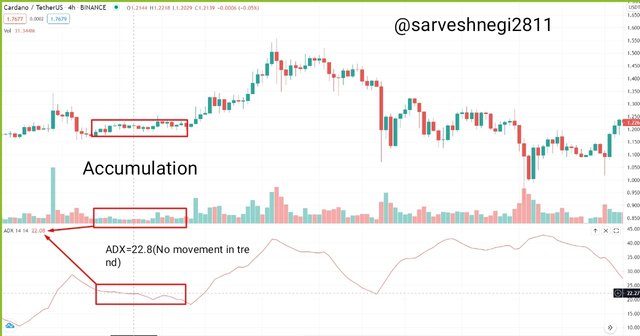
If you see the accumulation step in the market cycle of an asset you will see a sideways movement in the price, which means that there is not any increase and decrease in the price of that asset with no movement in the volume of that asset too.
How to spot the accumulation phase in a price chart?
Sometimes traders or investors solely depends on Wycoff's theory to spot the phases in a market cycle and thus don't get an accurate trend.
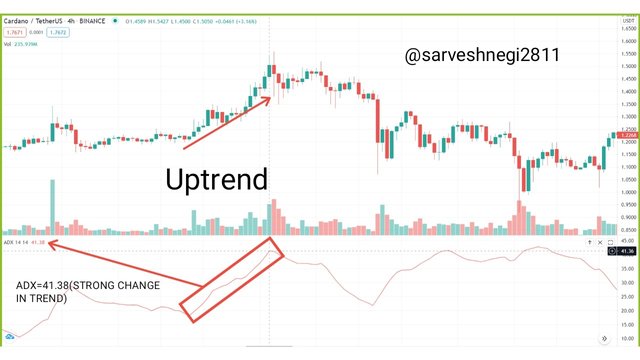
So to tackle that situation one should always use other indicators, mainly trend indicators like Average Directional Index(ADX).
ADX helps us to know about the strength of a trend.
When the value of ADX is above 25, it shows a strong trend and when the value of ADX is below 25, it shows no change in trend or a weak trend.
(2) An upward trend or Markup phase
The Composite Man has done his work of gathering asset to limit the supply.
Now Composite Man starts raising the market, by raising the market an emerging or upward trend can be seen, by doing that Composite Man gains the attention of users which leads to the demand for the asset among traders.
Whenever demand exceeds supply you can see the hike in the price of an asset.
Demand > Supply
Hike in price
There are some points where the market will show an accumulated phase in an uptrend, these points show re-accumulated phases.
I don't know the reason for the re-accumulated phase but I'm guessing that it is because of the hike in price, some holders might want to take advantage of the hike in price and start selling their asset, so I think that to limit the supply again those re-accumulated phases occur in an uptrend.
In the price chart, you will get to see the change in trend because of breaking out of the price from the range of the accumulation phase.
How to spot the uptrend in a price chart
It is easy to don't an uptrend in a market cycle, we just have to use the Average Directional Index(ADX).
Whenever the value of ADX goes above 25 it shows a strong trend.
We can also use MACD or RSI to spot the change in trend as these two are trend indicators.
(3) Distribution
This phase starts from the point where the markup trend ends.
This phase doesn't show any movement in the trend or a week trend can be seen.
As the price has reached its highest point during the markup trend, this phase is the suitable point for Composite Man to sell his holdings to traders that entered the market during the distribution phase or entered after the end of markup trend, this process of selling holdings by Composite Man will continue until the demand for the asset gets fully absorbed in the market.
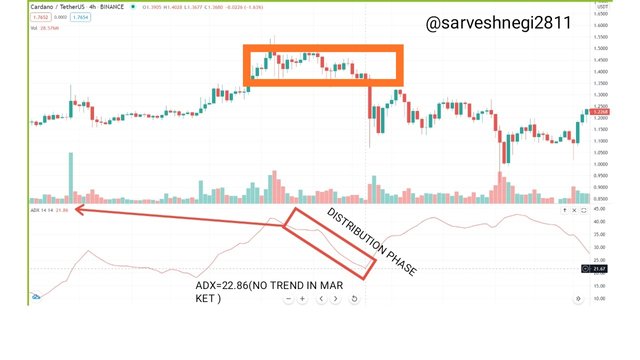
If you see the distribution phase in the chart you will see a sideways movement in the price because of the constant supply of an asset.
How to spot the distribution phase in a price chart
One should always use a trend indicator like the Average Directional Index(ADX) to determine the strength of a trend.
ADX tells us about the strength of a trend.
When the value of ADX is above 25, it shows a strong trend and when the value of ADX is below 25, it shows no change in trend or a weak trend.
In the case of the distributive phase, ADX will show a value below 25, that shows a weak trend or no movement in trend.
(4) A Downtrend or Markdown
You must have noticed the wittiness of Composite Man all along the market cycle until now, how he controls the market and manipulates the traders to enter the market.
So a downtrend phase starts when the Composite Man has sold enough amount of his holdings.
Composite Man will now try to push the market down and that leads to a downward trend.
every holder wanted to take advantage of a hike in price by seeking his holdings and that will lead to a sufficient or more supply of asset in the market.
Whenever supply exceeds the demand you can see the drop in the price of an asset.
Supply > Demand
Drop in price
There will appear some distribution phase during an uptrend, these phases are called the re-distribution phase.
Note or warning: These re-distribution phases comprises a trap called bull trap. Traders think that the market will go up from that point and enter the market, instead market goes to a more bearish zone.
How to spot a Downtrend or Markdown phase in chart
To spot the downtrend I would prefer slow stochastic with Wyckoff's method.
Slow stochastic is also a trend indicator, it sows value less than 20 when the asset is being oversold and shows a value above 80 when the asset is being overbought.
So when a markdown phase starts the value of slow stochastic will go below 20 showing the oversold region or reflects that supply exceeds the demands in the market.
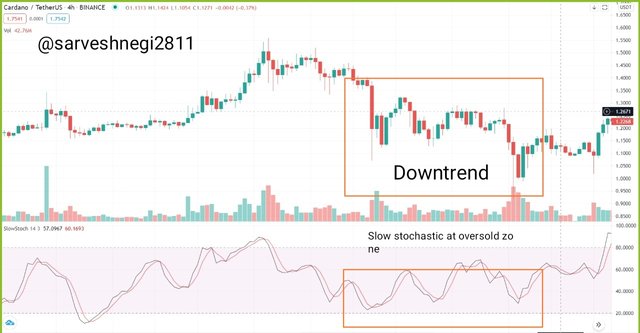
Downtrend using slow stochastic
My point of view about Composite Man
Well, I can't say anything but admire Richard Wyckoff for developing the idea of Composite Man.
If we can keep track of the movement of Composite Man, we can buy or gather enough amount of the asset at a lower price in the accumulation phase.
Demand will automatically exceed in the market when the supply is limited, and then we can wait for the Composite Man to raise the market making an uptrend.
Whenever we find ourselves in a great position to sell above accumulation phase we can book our profit and leave the market or we can wait till the Composite Man starts selling his holdings.
One can make a profit if he knows how to spot the phases and trend in the market cycle of Wyckoff's method.

Fundamental laws of Wyckoff
It is very important to study these laws for trading knowledge.
Each law tells us about how price and volume work in a market.
There are 3 fundamental laws of Wyckoff:
(1) Supply and Demand
(2) Cause and Effect
(3) Effort vs Result.
(1) Law of supply and demand
It is a very basic law with three conditions:
(1) When supply exceeds demand, you will see a fall or drop in the price of an asset. ( Markdown phase or downtrend)
(2) When demand exceeds supply, you will see a hike in the price of an asset. (Markup phase or uptrend)
(3) When demand and supply are equal, you will see no movement in price.
(Accumulation and Distribution phase)
To get better or accurate data one must see the price change and volume bars.
Keeping tracks of both price and volume bars can help traders to easily understand the law of supply and demand.
(2) Law of cause and effect
You all must have heard about Newton's law of motion.
You can say that this law is another form of Newton's 3rd law, which states that "Every action has an equal and opposite reaction"
In the market cycle, the accumulation phase is the action and the amount and time of gathering asset show the strength of that action.
After the action(accumulation), an uptrend can be seen which is the reaction to that action.
The strength of the uptrend depends upon the time and amount of asset gathered in the accumulation phase(action).
The same goes for the distribution phase which serves as an action for the reaction(downtrend).
If you didn't get the example given above I can simply state the law given by Wyckoff to you all.
According to him, everything in the market is a result of a previous cause and action.
Cause: Accumulation
Effect: Uptrend
Cause: Distribution
Effect: Downtrend
The strength of the trend(Uptrend and Downtrend) can be predicted by the amount of asset gathered or by the period of the accumulation and distribution phase.
(3) Law of effort vs result
This law states that for every effort in the market there will be a result.
Effort refers to the trading volume of that particular asset.
And the result will be seen with the movement in the price of the asset.
Large effort(trading volume) results in a large price movement.
If a large effort provides a small movement in results, it shows the divergence in the market and a tiring uptrend, to correct the trend corrective waves can be seen.
My point of view about Fundamental laws of Wyckoff
(1) For the first law of demand and supply, I think anyone knows about it already.
I would prefer not to buy the asset when the demand is very high or not sell my holdings when the supply is high, to make a profit.
(2) By the second law, I get to know about the cause and its effect, the stronger the cause, the stronger the effect or vice versa for the weaker cause.
For example you might have seen the price of steem nowadays, the price of steem is constant for weeks, that shows the accumulation phase and the the constant price is the cause for the upcoming hike in the price of steem, which will serves as its effect.
(3) My point of view about the 3rd law is that for any effort, we will be getting a result, so just wait for the large effort(trading volume) and then enter the market to make a profit, and exit the market if the effort and result doesn't show any connection between them because of a divergence in trend.

Some requirements must be met to analyse the chart with Wyckoff's method.
Those requirements are :
(1) Market trend: It is important to see the movement of price in the market whether it is making a bullish trend or a bearish trend.
Check for the volume if it showing the supply and demand of the asset in the market.
(2) Pick an asset that follows the market trend: An asset that follows the market trend must be chosen so that we can compare our asset with the market.
An asset with sufficient volume so that one can track the movements showing demand and supply of that asset in the market.
I am going to analyse Cardano.
Cardano is at 5th rank in the market on the basis of market capitalisation.Trading volume of last 24 hr : $3B(approx)
Recently there is not any noticeable movements or a little bearsih movements in Cardano, as the market is in a bearish zone nowadays.
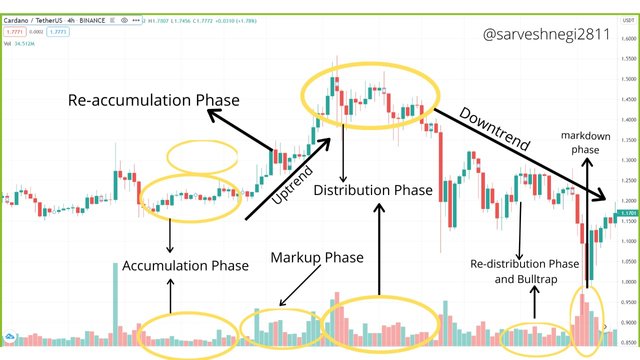
Phases in market cycle of Cardano
Analysis
(1) Accumulation phase: It is the phase where Composite Man starts gathering asset steadily and slowly so you can see in the above example that the price is showing sideways movement with no movement in the volume of the asset.
(2) Uptrend or Markup phase: In this phase Composite Man start pushing the market up to increase the price as he has limited the supply of the asset, you can see the price going upward making a bullish zone and at the same time volume goes up with the hike in price.
- Re-accumulation phase: A re-accumulation phase can be seen during the uptrend with a constant volume or no movement in volume.
(3) Distributive phase: As it is the phase where Composite Man starts selling his holding to make a profit and traders buy the asset at this point, you can see the sideways movement in the price of the asset with a constant movement or no movement in the volume.
(4) Downtrend or markdown phase: At this point, Composite Man will start pushing down the market after the demand gets absorbed and that leads to a downtrend or bearish movement in the price.
You can see the hike in volume which is showing the oversold zone.
- Re-distribution phase: A re-distribution phase can also be seen during the downtrend, some traders think that price will go up again making a bullish zone and enter the market at this time but the market falls to a new point and starts the new market cycle. This is called a bull trap.
That was all the phases in the market cycle of an asset.
After that we just have to comapre our asset to the market, which is difficult to pull off in the world of cryptocurrency instead we can compare our asset with BTC beacause of the dominance of BTC in the market.
This step is known as comparing asset.
Conclusion
In conclusion I just want to say that Wyvkoff's method is an interesting and useful method which can be used by traders.
Once traders know how to spot different phase and a market cycle, it will be easy for them to make their entry and exit point perfectly.
But a suggestion from my sIde, and that is to be stay vigilant while spotting a market cycle using Wyckoff's method, or use some trend indicators while trading with Wyckoff's method like RSI, MACD and Slow stochastic.
Ps : All the screenshots have been taken from Trading view and edited by me.

That was all from my side
Thank you
For the attention of @fendit
Thank you for being part of my lecture and completing the task!
My comments:
Wow, this was such good work :) Very nicely explained and everything was really good.
Excellent work on your chart and analysis, it was really interesting to see you apply all concepts in such clear way :)
Overall score:
10/10
Thank you professor @fendit 😇.
Hello dear Professor @fendit I have submitted my homework last week but yet not checked by you kindly please check my homework i shall be very thankful to you for this.
https://steemit.com/hive-108451/@zeeshanakram/steemit-crypto-academy-season-2-week-8-the-wyckoff-method-by-zeeshanakram