Steemit Crypto Academy | Course 2 | How To Read Candlestick Charts In Different Time Frame & Information about Buy-Sell(Support & Resistance) by @sammylinks (100% powered up)
Hello everyone
Hope everyone is doing very great just like me. I'm here to work on the homework from our cryptoprofessor @stream4u on how to read candlestick charts and other intending questions.
INTRODUCTION
.jpeg)
Candlestick charts are a type of financial chart for tracking the movement of securities. They have their origins in the centuries-old Japanese rice trade and have made their way into modern day price charting. Some investors find them more visually appealing than the standard bar charts and the price actions easier to interpret.Source.
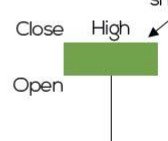
However, There are two Candle sticks, we have and as can be seen in the chart above. There are the;
BULLISH CANDLE STICK
This bullish is the Green Candle stick which is used to show an uptrend pattern. Bullish candlestick shows buying pressure and also show the entry points for long trades which can help predict when a downtrend is about to turn around to the upside.
BEARISH CANDLE STICK
Unlike the Bullish Candle Stick, Bearish Candle Stick is the Red Candle stick which is used to show an downtrend pattern. It has a white or hollow candlestick means that the closing price was greater than the opening price.
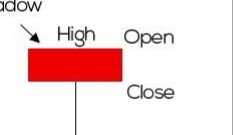
However, it has similar features with bullish but a little differences. These features of this candle stick represents the opening price, the closing price, the high price, and the low price while the body represent the closing price was greater than the opening price.

EXPLAIN WITH CANDLE CHART, WHAT ARE THE TIME FRAMES AVAILABLE THAT WE CAN SET INTO THE CHART, AND WHY IT NEEDS TO CHANGE THE CANDLE TIME FRAME?
Moreover, The time frame of the candle stick chart usually based on the type of a trader, the nature, the volume of the trade and signal for the basis of trading decision.
TIME FRAME
The time frame is a certain period of time that is determined to observe price movements. Each Time Frame has a different price movement.
.png)
In general, there are time frames of 1 minute, 5 minutes, 15 minutes, 30 minutes, 1 hour, 4 hours, 1 day, 1 week, and 1 month.
In the above timeframe, those candlestick is found on the chart. With the many time frame choices, it is easier for us to analyze the direction of price movements on the chart.
.jpeg)
Time Frames & Trader Types
There Are Different Types Of Traders Based On Timeframe. They Includes:
- Day Trader
- Short Term (SCALPER)Traders
- Long Term(SWINGER) Traders
DAY TRADER
They are those traders whose open-close transactions are within a day. They usually choose a time frame between hourly and daily.
SCALPER
They Are also called the Short-term Traders Whose Open And Close Transactions lasted For A Short Period Of Time. Traders Of This Type Focuses Their Trades Based By Using Charts With Time Frames Between 1 M (Minutes) To 30 M (Minutes).
SWINGER
They are also known as long-term trader whose open-close transactions are in the range of days to weeks, even months. This trader usually uses the four-hours time frame, daily to monthly.
Thanks to crypto-professor @stream4u and worth to be mention:
@steemcurator01, @steemcurator02 and @steemitblog.
All pictures are copyright-free and their sources stated appropriately. Unless otherwise comes from my screenshots of infinix 4 pro
Hi @sammylinks,
The information on the below topics is missing, can you please edit this existing post and add those to complete the task?
Thank You.
@stream4u
Crypto Professors : Steemit Crypto Academy
#india #affable