Crypto Trading With Williams % R Indicator - Steemit Crypto Academy- S4W4- Homework Post for @kouba01
This is Season 4 Week 4 of Steemit Crypto Academy and I'm writing homework task about Crypto Trading With Williams % R Indicator assigned by Professor @kouba01
Question# 1
Explain the Williams %R indicator by introducing how it is calculated, how it works? And what is the best setting? With justification for your choice.
Williams %R indicator was indicated by Larry Williams in 1973. It is one of the key technical indicators used by traders to study changes of momentum. It is widely used to anticipate the pace of price movement, zones of accumulation and trend reversal patterns which provide the basis for placing buying and selling signals.
It is also used in quantitative analysis of the price to evaluate bullish and bearish trend strength to predict reversals. The indicator is also known by the Williams percentage Range. It oscillates between the levels of 0 and 100 and indicate overbought and oversold signals. It is used in the same way as the stochastic oscillator.
It quantifies bearish and bullish signals by comparing closing prices of an asset with the high and low range. When it is below the level 20% it indicates an overbought market sentiment and the reading more than 80% indicates an oversold market sentiment.
It is important to understand that an overbought for instance does not indicate a market reversal but it shows that the market is close to its previous high range and the same is true of oversold condition which indicates that the market is close to its previous low range.
Trade signals are placed when the market moves away from these levels.
Calculation
Williams %R is calculated by first selecting a period such as 14, we than note down the closing price, highest value and lowest value of the asset in that period.
The formula is:
Williams %R=Highest High−Close/Highest High−Lowest Low
Highest High=Highest price in the selected period, typically 14 days
Close=Recent closing price
Lowest Low=Lowest price in the selected period, typically 14 days.
Choice of period
By default, we have a setting of 14 i.e., hours, days or weeks. This setting can be changed based on traders trading style, strategy and style of trading. Scalpers use shorter periods while swing traders may use 14 or above. The best setting however can be obtained by trying different periods coupled with your trading style and strategy and examining which period setting best suits your setup.

Question# 2)
How do you interpret overbought and oversold signals with The Williams %R when trading cryptocurrencies? (screenshot required)
I already discussed the concept of overbought or oversold signals above. Thus, for this part of the post I will explain them further. %R indicator helps us locate buying and selling entries based on the highest and lowest value of the asset in the selected time period.
This formula discussed above tells us where the price is currently relative to the highest value in the last 14 days (or any multiple of 14 selected). When the %R line moves between 0 to 20 the price is close to its highest value or is in an overbought situation. On the contrary when the %R line moves between 80 to 100 it is close to its lowest range or far from its highest value in the selected period and indicates an oversold condition.
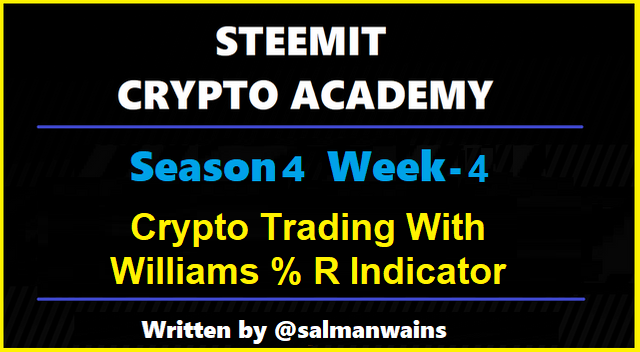
Overbought condition
An overbought point is not a reversal but it surely predicts a reversal in the market as an overbought condition is marked by greater buying pressure. The market pattern shows higher highs and higher lows during this period as indicated in the chart of LINK/USDT below. The overbought signal was followed by a downward reversal but it is always better to wait once the downward begins to trade for short.
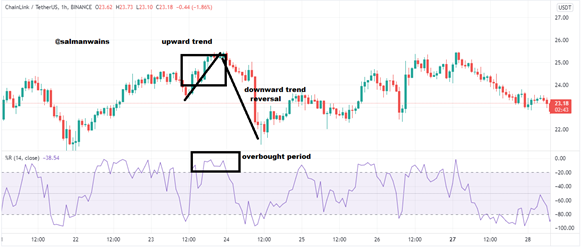
Oversold condition
When the line is oscillating between 80 to 100 it is an oversold point of the market followed by an upward shift in the momentum of the market and an increase in the price. The oversold condition indicates a higher selling pressure on the market. upward shift was seen once the market left the oversold condition in the LINK/USDT chart below.
Question# 3)
What are "failure swings" and how do you define it using The Williams %R? (Screenshot required)
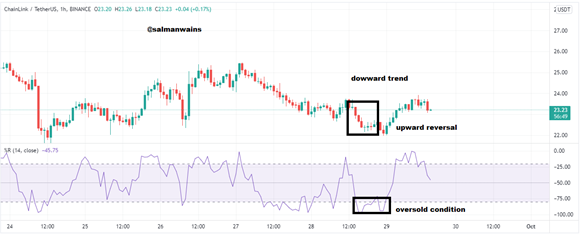
Sometimes the price line shows reversals although the %R indicator has not reached the upper or lower thresholds. It is that the reversal occurred before Williams % R reached the upper or lower thresholds. Such swings are called failure swings as they failed to reach the desired levels to correctly predict reversals. It is mainly due to weak trends or corresponding buying and selling pressure.
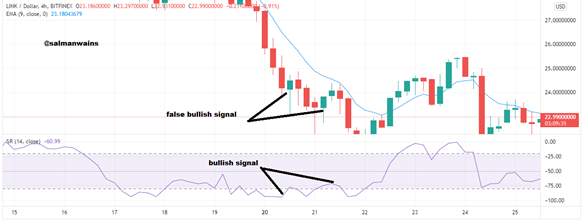
In the LINK/USDT chart below we saw a weak uptrend which was immediately followed by a downward reversal and below we see a failure swing which was not able to reach 20 level when the reversal happened. It is a bullish failure swing. It was that the %R line was approaching the 20% level but the failure swing resulted in a quick downward reversal.
In the similar way when a weak downtrend is followed by an uptrend before the %R line reaches the -80% level we see a bearish failure swing.

Question# 4)
How to use bearish and bullish divergence with the Williams %R indicator? What are its main conclusions? (screenshot required)
Divergence as the name indicates a contradiction of direction between the price action and the %R indicator. These are usually taken as early signs of trend reversals. In a bullish divergence we see a higher high in %R line while the price action is bearish. This movement is often followed by a bullish market move since the %R line is moving upward. This an ideal point of trade for experienced and risk-bearing traders who used this movement for placing buying bids.
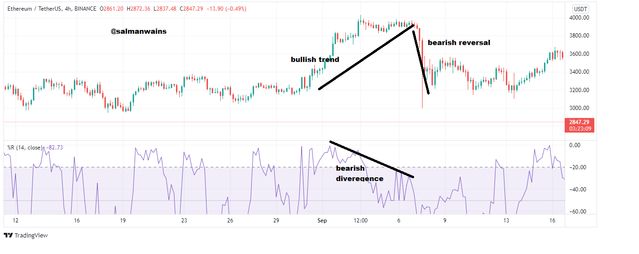
In the chart below we see a bullish divergence where we pinpoint that the successive highs were higher than the previous although the overall trend was bearish. It was then followed by a bullish reversal.

In bearish divergence the %R shows lower highs or the current high is lower than the previous although the overall trend will be bullish. For example, in the ETH/USDT chart below we see lower highs although the trend was bullish and it was finally followed by a bearish reversal.
Question# 5)
How do you spot a trend using Williams %R? How are false signals filtered? (screenshot required)
William %R is used to spot trends by comparing the direction of the price line and the %R line. This movement should be parallel for a trend to be valid. For instance, if the price is moving higher the %R should also be moving higher and vice versa. In a bullish trend when the %R line is moving above the 50% level the trend is strong similarly in a bearish trend the %R line should be moving below 50% level.
To avoid false signals, it is always better to use a combination of indicators such as the MACD, or sometimes simply moving averages.
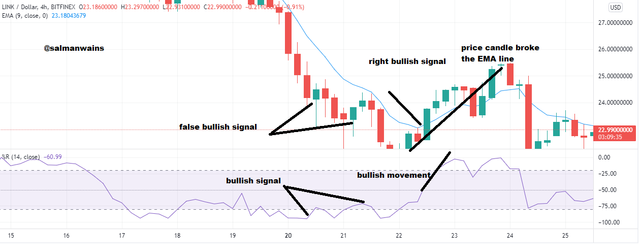
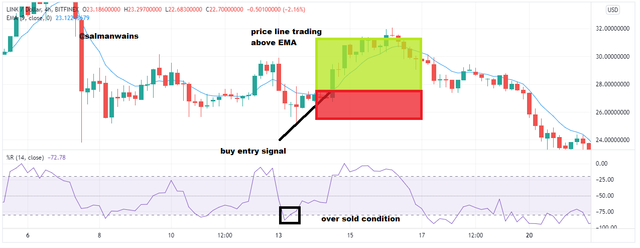
In the chart below we see a false bullish signal. It is a false bullish signal because the price was initially in an oversold condition; it moved above the 80 line but the EMA line confirmed that a bullish signal can not be anticipated at this point of the market. The price was still moving under the EMA line indicating a continuity in the downtrend.
The correct signal will be that best satisfies the indications of the %R and the EMA. Such that shown in the chart below we see a correct signal. The %R line moved above the 50% level in an upward direction. The price line also broke the EMA line confirming a strong bullish trend.
Question# 6)
Use the chart of any pair (eg STEEM/USDT) to present the various signals from the Williams %R indicator. (Screen capture required)
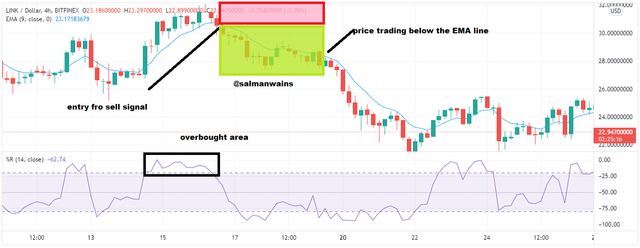
In the chart above we see a sell signal. The sell signal is found after an overbought condition when the %R line begins to move below the 20 level. In the chart above we see that once the break came out of the overbought condition the price line start trading below the EMA line indicating a valid down trend as soon as the price line broke the EMA to move below, we can place the sell signal the profit loss can be 1:2 or 1:1 as desired by the trader.
In the chart above we see a buy signal. After the oversold condition when the %R line begins to move above the 80% level we have various opportunities for placing buy orders once the price breaks the EMA line.
Conclusion
Williams %R is a very desirable indicator which indicates trend movement, price momentum and trend reversal patterns. It is less confusing as its movement is parallel to the movement of the trend.
Mostly it gives clear signals but there is always room for false signals thus using it along moving averages or other technical indicators always provide good trade setups.
Hello @salmanwains,
Thank you for participating in the 4th Week Crypto Course in its 4th season and for your efforts to complete the suggested tasks, you deserve a Total|4.5/10 rating, according to the following scale:
My review :
Work with under medium content. It was possible to deepen the ideas presented and provide many examples. Here are some notes I have for you.
Your explanation of the WPR indicator was brief and did not highlight its most important features.
Like, you didn't justify your choice of settings.
It did not provide a good explanation of the indicator's relationship with the trend and its implications and similarly to confirm the signals.
The rest of the questions and I'm a little satisfied with your answer.
Thanks again for your effort, and we look forward to reading your next work.
Sincerely,@kouba01
Dear Professor @kouba01,
I really appreciate Your efforts for Steemit Crypto Academy as Professor. You are doing a good Job amd we are having a great learning experience.
But I'm totally Unsatisfied with Your Remarks and Ratings on This Task.
Like here You mentioned thar I didn't justified Choice of setting. Please have a look again and then tell me if the setting is justifiable or not and if Yiu still think it requires more then please mention what exactly you were looking for?
Again, it was really a disappointment when You put effort and get this kind of remark on Your work.
Here is my question 5 where I talked about trend, false signals etc.
I want you to have a look at it
All your questions are legitimate and will have answers in the summary to ensure equality among all students.
First of all thank You for replying Professor @kouba01
I appreciate that and will love to see the summary.
But still I want you to please look at the marks given above. Don't You think they are still little less and deserved more than atleast 5+ for the vote?
I'm One of the senior Student of this academy and I'm doing almost every task of intermediate and Advance level every week.
I was among top 4 Students in last season (Season 3) competing with beckie, fredquantam and Professor nane
(Really dissapointed after getting these marks)
Just showing this screenshot to let you know that I understands almost each and every task and that's why got those marks and competing among most brilliant students of this academy.
My concern is...
Just have a look at the marks given above and if You think for a second that I deserved more than that then please do it accordingly and I will be really thankful to you for considering my request.
Thank You!
CC: @yohan2on
Dear Professors, Please have a look onto this issue and then respond accordingly if I'm wrong in asking about a rechecking. Mistakes happen with everyone and we should be wise and honest enough to accept those mistakes.
CC:
@kouba01, @yohan2on, @sapwood, @steemcurator01 and @steemcurator02
Hi, @salmanwains,
Thank you for your contribution to the Steem ecosystem.
Please consider voting for our witness, setting us as a proxy,
or delegate to @ecosynthesizer to earn 100% of the curation rewards!
3000SP | 4000SP | 5000SP | 10000SP | 100000SP