Steemit Crypto Academy Contest / S15W4 - Death Cross Vs Golden Cross
When I talk about golden crossing then it is a terminology for describing a kind of intersection act which there could be high amount of accidents or incidents you can say. When any kind of intersection occurs then it is called that golden crossing is occurring. If I talk about death crossing then it is intersection which has high number of accidents that are fatal as the name is indicating that it's death crossing so you can say that this intersection is a situation which is very serious. It was all about my explanation in simple and layman's language and it is not the actual explanation of both these terms and I have explained it just to clear about simple basics of it now let's move towards proper explanation in terms of market and cryptocurrency.
If you made technical analysis anytime in life then I think it would be clear about both terms that they are very important in technical analysis when you analyse the charts of cryptocurrencies trends in market.
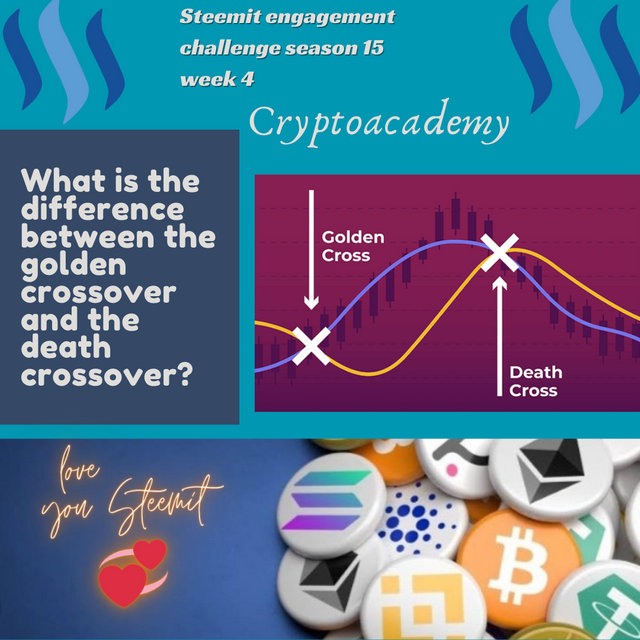
Golden crossing is defined as positive signal which is bullish signal and it occurs when short term moving average cross from the above of long term moving average. If I talk about short term moving average then most probably it is a moving average which is of 50 days and similarly in long term moving average there are 200 days so when short term moving average cross from the long term moving average then it indicates that that there is a positive and upward trend in the price of cryptocurrency so in this way it gives a positive news and sentiment by traders and investors because in this way momentum seems to shift towards positivity and upward trend.
If Golden Cross by its name is indicating that this is something positive then death cross by its name is indicating that this is something very negative so if that was a bullish trend then it is a bearish trend and in this short term moving average cross below than the long term moving average. Again you can think and you already know from my above explanation that there are 50 days in short term moving average and there are 200 days in long term moving average that's why when short term moving average is going to cross below than long term moving average then it is a suggestion of downward trend in our all cryptocurrency price so this is a negative news and negative sentiment for the traders and investors because it is the indication that momentum is shifting in market in downward side.
If I talk about both these significant terms and if I talk about golden crossing and death crossing then both these are very important while making the technical analysis because they are based on the interaction of two moving average is that how they are interacting with each other so these are some of the most significant things because it make clear and investors that in which time they should buy and in which time they should sell so it open the buying and selling opportunities for traders in market as well as these signals are also important because they can also be used in conjunction with other indicators and make analysis most stronger and for the elimination of any kind of risk.
| GOLDEN CROSSOVER and DEATH CROSSOVER |
|---|
According to my point of view golden crossover refers a buy signal because it indicates the uptrend in the market and also it refers to a bullish signal in technical analysis on trading view.
Death crossover refers a sell signal because it indicates the uptrend in the market and also it refers to a Bearish signal in technical analysis on trading view.
Now we try to understand that when it happens? In order to understand this we need to know about EMA( exponential moving average) . EMA is an exponential curve which tells us about the moving average in different time frames. We can set this EMA according to our choice . We can see on trading view the EMA of 50 days ' 60 days or 1 day even of 1 year, depends on our choice and analysis.
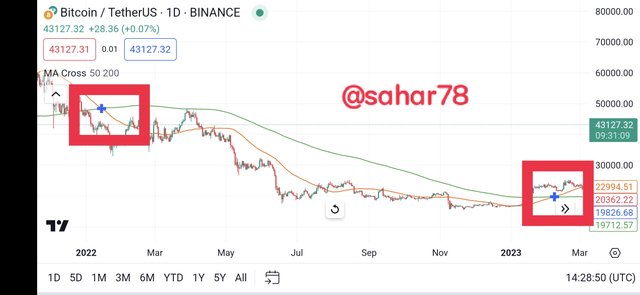
Now we can understand that when golden crossover happens, it happens when a short time MA crosses above the long time MA usually the two hundred days which shows an uptrend signal in the market and at that point traders make their entry after confirmation and then start buying.
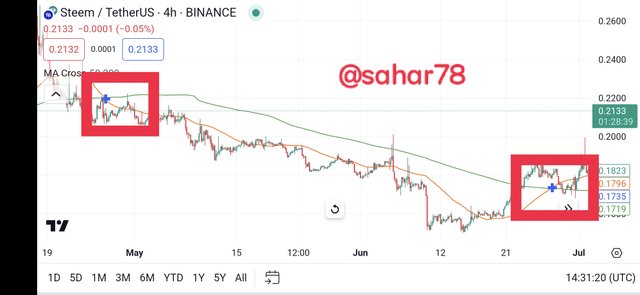
When we see the crossing of EMAs in such a way that the short term MA doesn't croos over the long term MA and then probability of downtrend increases in that situation. Now we understand when it happens, it usually happens when short term MA crosses below the long term MA which indicates the bearish signal and there will be start a downtrend in the narket . In this situation the sellers confirm their entries and after selling alot the price is reduced.
There are different type of differences that I can explain in between the golden crossover and death crossover so let me share it with all of you in the form of different points.
| Golden Crossing |
|---|
Golden crossing is defined as an intersection in which there is a risk of accidents and incidents in higher amount but there is less risk of death and this is a definition which is just like an example from daily life to make the basic concepts clear but actually Golden crossing in cryptocurrency is just like a bullish trend which indicates are positive sentiment in cryptocurrency due to an indication of pump in price.
In Golden crossing there is some protection and level of attention is required by traders and investors while making decisions.
- Traders and investors may use other safety measures in Golden crossing by making their technical analysis more stronger by the use of involving other indicators in which they have more believe.
| Crossing of death or death crossover |
|---|
- If I talk about crossing of death or death crossover by taking a daily life example then it is appoint or intersection act which there could be high risks of deaths or fatal accidents so it is indicating by its name that it is something negative which is going on in cryptocurrency so it is an indication of actually downward or bearish trend in cryptocurrency which creates and negative sentiment in overall market and traders.
- Death crossover is an indication that all that traders and investors should be well prepared mentally for some serious consequences that could be a dump in market of high intensity.
- Death crows over is an indication that traders and investors have high need of showing their attention in market for making this intersection safer for their personal benefits and overall benefit of market.
Now I am going to summarize all my points with the help of a table so I am hopeful that with little explanation in this table it work to become more easier to explore the differences in both of them which are very easy to understand
| Golden Crossover | Death Crossover |
|---|---|
| Bullish signal indication that there is something positive here | Bearish signal indication that something is negative here |
| Short-term moving average rises than long term moving averages in this condition | Short-term moving average falls than long term moving average in this condition |
| Long-term moving average rises than short term moving average | Long-term moving average falls than short term moving average |
| Indicates potential upward trend so it cause increase in buying by traders and investors as it is something positive and favorable for the overall market | Indicates potential downward trend increase selling pressure as it is something negative and unfavourable for overall market |
| Momentum shifting towards upside so cause increased in price of cryptocurrencies in other words | Momentum shifting towards downside so cause decrease in price in other words |
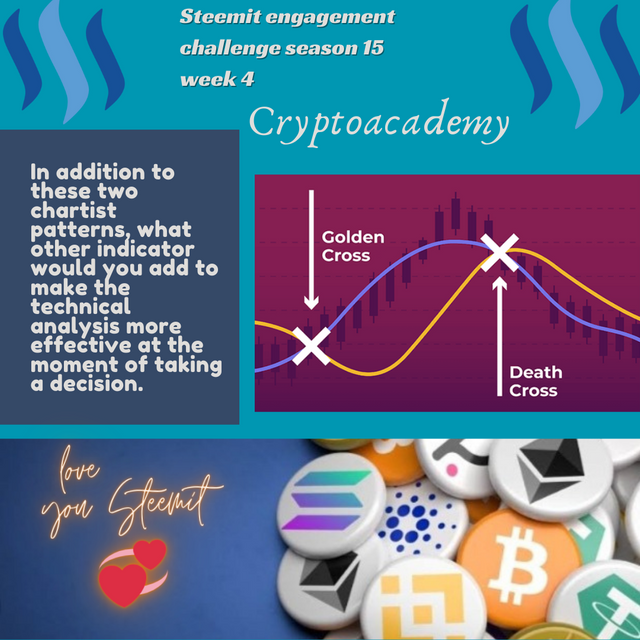
While making the technical analysis it is more effective if before making any informed decision you would include other indicators also for making your analysis more stronger so here are some of the indicators that I am going to explain that can help you in making decisions.
| Moving Averages |
|---|
Moving average is a source that smooth out data of price in a specific period of time and it also indicates a trend that is following by the indicator. It is very helpful in the identification of the direction of trend that it is in upward direction or it is in downward direction and in this way it is a source to provide the support and resistance levels.
| Relative Strength Index (RSI) |
|---|
Relative strength index is the abbreviation of RSI and this is a momentum oscillator which is used for the measurement of speed and change in the price movements so it may over buying and overselling conditions which indicates significant trend reversals.
| Bollinger Bands |
|---|
When we talk about bulingar bands then it contains moving average and two standard deviation lines which becomes very helpful in the identification of the volatility and significant break out of price of cryptocurrencies so when price moves towards the outer bands then it indicates that there is a continuation of particular trend.
| MACD (Moving Average Convergence Divergence) |
|---|
Moving average convergence divergence is a indicator which is trend following and it helps in the identification of significant trend reversals that are bullish and bearish crossovers and divergence between the MACD line and signal line.
| Fibonacci Retracement |
|---|
Fibonacci retracement levels are helpful in the identification of the support and resistance levels depending upon the Fibonacci sequence so traders use these levels most of the time for the determination of entry and exit points.
| Volume Analysis |
|---|
Volume analysis is very helpful in the identification of the strength of particular price movement so higher volume during increase and decrease in price can indicate that there is a conviction behind move.
That was my explanation related to some of the technical indicators so hopefully you all would like it and understand it.
I want to invite
@peo07
@alejos7ven
@sualeha
To participate 😊
Upvoted. Thank You for sending some of your rewards to @null. It will make Steem stronger.
TEAM 5
Congratulations! Your comment has been upvoted through steemcurator08.Thanks @josepha
When my dear friend you have very clearly mention the differences and the very precise and definition of Golden cross and death cross which is easy to ended stand for all of us and second answer you have given question to the answer very well when you are using the chart analysis and you have very clearly defined each and every chart which makes clear and understanding and the last question you have answered very well and you have given so many indicators and I even don't know some of the indicators best of luck my friend for this contest
Greetings friend,
I really appreciate the effort you put into explaining the differences between the golden cross and death cross. Your definitions were spot-on and made it super easy for all of us to understand. You also nailed it with the chart analysis. Breaking down each chart in such a clear and concise way really helped us grasp the concept. Lastly, your response to the last question was amazing. You shared so many indicators, some of which I wasn't even familiar with. You're definitely rocking this contest. Best of luck, my friend.
Thanks you my friend you thought my post is good I will improve inshallah day by day
Dear @sahar78
° your explanation of what death cross and golden cross is to my satisfaction. You were also able to use the btc chart to explain the two chart patterns was awesome and made it more clearer.
° you also mentioned the notable differences between the two chart patterns which is well appreciated.
° You highlighted dand explained several indicators which could be used in conjunction with golden cross and death cross to get the best out of trading.
Overall. Your post was superb. Wishing you the best in this engagement.
Has resaltado la importancia que tienen las medias móviles cruzadas en el mundo de los traders.
Has dejado claro la definiciones de las cruces y sus diferencias son sabiduría y dominio.
Estoy de acuerdo con el uso complementario de los indicadors RSI, Bandas de Bollinge, MACD, Retroceso de Fibonacci y el análisis del volúmen.
Gracias por compartir, ¡feliz día y mucha suerte!
Your article is simple and clear to understand. You have given an explanation about the Golden Cross and the Death Cross and explained their differences. You have mentioned many indicators along with chart analysis which make trading more effective. You have done commendable work in this regard.