Steemit Crypto Academy Season 5 Week 3 [Beginner's Course] - Understanding Trends II


Hello Steemians, welcome to the 3rd week of season 5 in the Steemit Crypto Academy. I trust everyone is doing great. In today's lesson, we will continue our understanding of Trends as discussed in the previous lesson. In the last lesson, we discussed trends identification and also trend continuation.
Today's we will focus on identifying trend reversal using several methods. This will include:
Break of market structure.
Break of the Trend line.
Divergences.
Double top and double bottom formation.
Trend Reversal
As a trader, there's a need to understand that price won't always trend in one direction. There are bullish and bearish seasons in the market and as such, there is a need to understand the signal when there's a switch from one trend to another. This information will save you from getting caught up at the end of a trend or entering a position when the price is overextended.
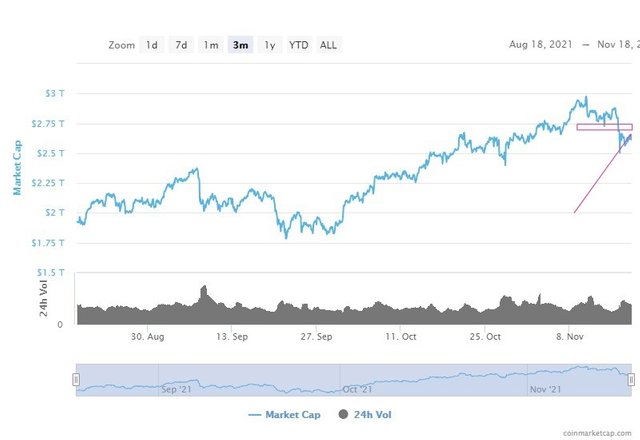
A good example is what is going on in the crypto market right now. The crypto market has been in an uptrend creating an all-time high at almost $3 trillion. Recently, we are seeing some pullback and possible trend reversal as the market cap has dropped down to $2.6 trillion.
A trader who understands trend reversal will know that the crypto market has been in an uptrend for a while and profits need to be taken off the market. But from what we are seeing from our trend reversal identification, it seems like bears are taking over the market as we have seen breaks of market structures and a break of trend lines. A trader who understands trends and their formation won't consider opening a position. Rather, patience is needed to confirm the trend reversal or continuation.
Now let's look at the different methods to identify trend reversal.
Break of Market Structure
In our previous lesson, we established the market structure for both bullish and bearish trends. We also stated the criteria for trend continuation that the new high must be higher than the previous high and the new law must not reach the previous low for an uptrend. Similarly, for a downtrend, it was stated that for trend continuation, the price must create a low lower than the previous low and the retracement must not be higher than the previous high.
Violation of the criteria above shows the inability of the current dominant force to keep pushing the price in the direction of a trend. When this happens in the market, it signals a trend reversal which will be confirmed as price breaks below the previous low for an uptrend and also a break of the previous high for a downtrend.
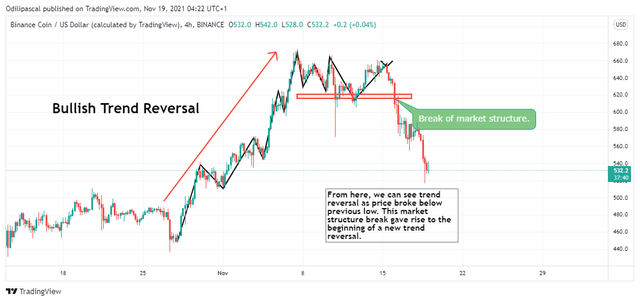
From the chart above, we can see how the price was in an uptrend creating higher highs and higher lows until the price failed to create a new high. This shows the weakness of the buyers to keep pushing prices up. This is a strong trend reversal signal which will be confirmed as the price broke below the previous low. The break of the previous low shows transfer of control from the buyers to the sellers. This means that the sellers have taken over the price and as such the beginning of a downtrend. This information is very important to exit a bullish position and look for a new entry to the downside.
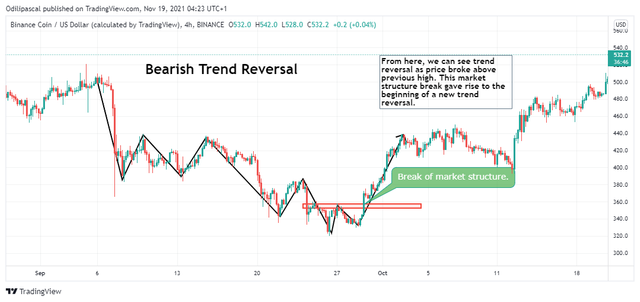
The chart above shows the bearish trend reversal of BNB/USD in a 4hr timeframe. Previously, the price was in a downtrend creating lower highs and lower lows until the price failed to create a new low. This shows the inability of the sellers to keep pushing prices down and is also a sign of weakness in the downtrend. This failure to create a new low is a strong reversal signal which was confirmed as the price broke above the previous high point. This shows the transition from bearish to bullish trends and also the control of price from bearish to bullish.
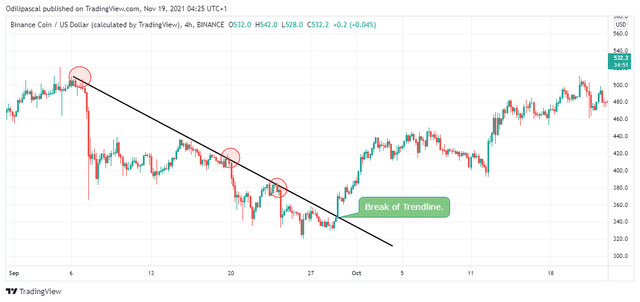
Break of Trendline
The trendline is an important technical analysis tool that helps traders to determine the direction of price. In our previous lesson, we have discussed that trendline and also how to determine trend continuation using the trendline.
A trend will be valid as long as the price keeps rejecting the trendline which serves as dynamic support and resistance for the price to continue in its original direction. A break of the trendline is a strong trend reversal signal which a trader should be alerted to make a trading decision.
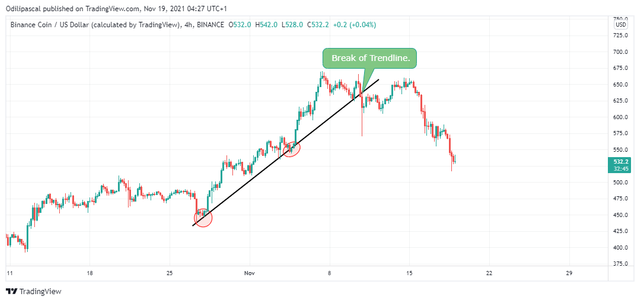
Looking at the current situation for BNB/USD, we can see how the price was respecting the trendline by rejecting it during a retracement. After some time, the price broke the trendline which is a trend reversal signal. We can see how sellers have taken over the market as the price keeps dropping.
The situation we have above is the case of a bearish trend reversal using the trendline. Price was in a downtrend respecting the trendline which serves as a dynamic resistance during a retracement. After some time, we can see how the price broke above the trendline which is a trend reversal signal from a bearish to a bullish trend.
This information can guide trade to make a good trading decision in the market and look out for good entry and exit opportunities.
Divergence
Divergences are also another way of identifying trend reversals by combining price action with an indicator. Divergences occur when there's a mixed signal between price action and the indicator signal. For example, price action might be signal a bullish trend by forming a higher high pattern while the indicator is signal a selling market structure by forming a lower low. The divergence of the indicator from price action is simply signalling a trend reversal in the market. This shows an early signal to traders to expect price reversal and also close up their positions before this reversal.
Bullish Divergence
The bullish divergence occurs when the price makes a new lower low point but the indicator is making a higher high point. This shows an early signal of weakness in the current bearish trend and a reversal signal to the upside. Traders can use this information to exit their sell positions and look for buy opportunities. An example of bullish divergence can be seen in the chart below.

From the chart above, we can see a bullish divergence between the price on the chart and the RSI indicator. The RSI indicator was showing a bullish signal by forming higher high patterns while the indicator was showing a lower low pattern. After the divergence occurred, we tend to see the price reverse to the upside.
Bearish Divergence
The bearish diverge occurs to show exhaustion and weakness in the current uptrend. This occurs when the price on the chart is showing a higher high formation while the indicator is showing a lower low formation. An example can be seen on the chart below.
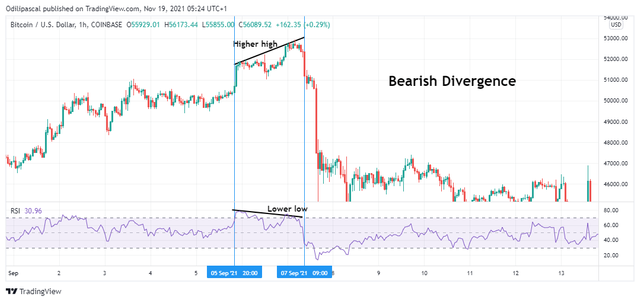
In the chart above, we can see how the price reversed to the downside after the formation of a bearish divergence. This gives traders early information to exit their buy positions and prepare to take advantage of the market reversals.
Divergences are no doubt another wonderful means of identifying trend reversals that can help traders make early decisions in the market.
Double Top and Double Bottom
Just like we have discussed the market structure formation, for the price to continue being in a bullish trend, a new high higher than the previous high must be attained. Similarly, for the price to continue in a bearish trend, a new low lower than the previous low must be attained. Failure to achieve this shows the inability of the buyers or sellers to keep pushing the price in the current direction.
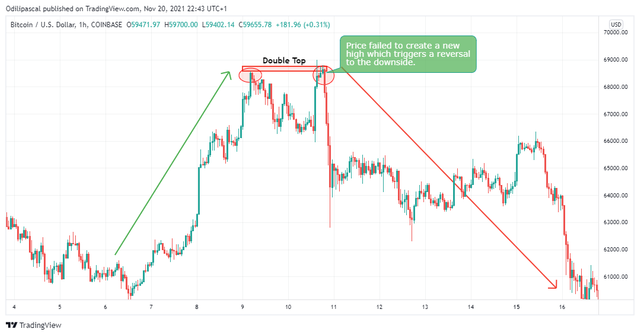
Double tops are formed during a bullish market. After price retrace for a continuation of the bullish trend, we tend to see price retesting the previous high and breaking it to form a new high. This shows weakness in the buyers to push the price to a new high. The double top is a powerful trend reversal pattern which a trader can capitalize on to. make good trading decisions.
The following criteria must be met for a double top:
Price must not break above the previous high point.
The closing price of the second top must not be higher than the high of the first top.
An example of a double top can be seen on the chart below.
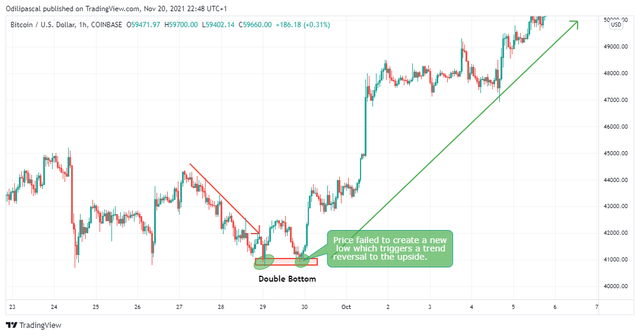
Double Bottom
Double bottoms are formed in a downtrend when the price fails to create a new low lower than the previous. Price retests the previous low without breaking below it. This shows the weakness of sellers to keep pushing prices down. The following criteria will be met for a double bottom.
Price must not break below the previous low.
The closing price of the second bottom must not be lower than the low of the previous bottom.
An example of a double bottom can be seen on the chart below.
Conclusion
In this lesson, we have discussed trend reversals and the previous ways we can detect trend reversals in the market. However, these patterns are just signal confirmation patterns that will be combined with other technical tools to make buy and sell decisions. These reversal patterns play crucial roles in giving a trader information on the next market direction. Traders can utilize this information properly to increase the success of their trading journey. Furthermore, wrong interpretation of these reversal patterns can be detrimental to a trader's funds.
Note: Information discussed in this lesson is for educational purposes and not financial advice. Ensure you make your research and employ good risk management before investing in any crypto asset. Cryptocurrency investment is very risky due to the highly volatile nature of the market.
Thank you for being part of this lesson.
Homework Task
a) Explain your Understanding of Trend Reversal. What is the benefit of identifying reversal patterns in the Market?
b) How can a fake reversal signal be avoided in the market? (Screenshot needed).Give a detailed explanation on the following Trend reversal identification and back up your explanation using the original chart. Do this for both bullish and bearish trends (Screenshots required).
a) Break of market structure.
b) Break of Trendline.
c) Divergence
d) Double top and Double bottomplace a demo trade using any crypto trading platform and enter a buy or sell position using any of the above mentioned trend reversal/continuation pattern.
Note that you will be patient with these patterns to unfold in the market before taking a trade. (Present a clear chart for the setup and also the proof of transaction. This can be done using any crypto-asset chart and also any timeframe).
Homework Guidelines
- Homework must be posted in the Steemit Crypto Academy community. Your homework title format should be " [Your Title] - Crypto Academy / S5W3- Homework Post for @reminiscence01".
- Plagiarism is a great offence in Steemit Crypto Academy and it won’t be tolerated. Ensure you refrain from any form of plagiarism.
- Your post should not contain less than 400 words.
- All images, graphs, and screenshots from external sources should be fully referenced, and ensure to use watermark with your username on your screenshots.
- Use the tag #reminiscence01-s5week3, #cryptoacademy, #club5050 if eligible and your country tag among the first five tags. Also include other relevant tags like #trend, #trendreversal #cryptocurrency.
- Only users who meet the requirements for #club5050 are eligible to participate in this homework task.
- Homework task run from Sunday 00:00 November 28th to Saturday 11:59 pm December 4th UTC Time.
- Only users with a minimum of 300 SP and having minimum reputation of 55 are eligible to perform this homework. Also, note that you must not be powering down.
- Users who have used upvote tools to gain SP or build their reputation are not eligible for this homework.
- To be eligible for #club5050, a user must have powered up 150 Steem in the last month.
Note: You can only drop your homework link in the comment section if not reviewed after 48 hours.
The comment section is freely opened for suggestions and feedback on the lesson and homework.
Cc: @steemitblog
Hi professor @reminiscence01... My post for your last class was not curated. Here is a repost:
https://steemit.com/hive-108451/@okunlolayk/re-post-understanding-market-trends-or-crypto-academy-s5w1-homework-post-for-reminiscence0
Kindly consider. Thank you
excellent congratulations that you are uploading your steem Power
The lectures are amazing Professor @reminiscence01 I will finish this homework.
This is a good college. Hopefully with lectures like this we can understand the trading market
https://steemit.com/hive-108451/@salemumar5/repost-steemit-crypto-academy-season-5-week-1-beginner-s-course-understanding-trends-by-salemumar5
My post was not curated professor and i reposted again.
@steemcurator01
@reminiscence01
Alright. Your post will be curated.
Thanks professor
The lecture will be very helpful for beginners, held a good revision for me so I will do participate in this to check my ability regarding market formations.
Nice lecture from you professor, still accessing it and hopefully to submit mine soonest
Thank you. I look forward to your homework task.
Cool lecture boss, I will submit my post soonest
Nicely delivered, profeesor.
Anticipate my entry soon!!
Good lecture professor. I hope you will like my homework.
Thank you. I look forward to your submission.