[Repost]Steemit Crypto Academy Season 5 Week 1 [Beginner's Course] - Understanding Trends by @salemumar5
Post ain't curated yet

Homework Task: Beginners

Explain the following :

1) a) What do you understand by a Trending market?
b) What is a bullish and a bearish trend? (screenshot required)
2) Explain the following trend identification and give an example of each of them. (Original screenshot needed from your chart). Do this for a bullish and a bearish trend.
i) Market Structure.
ii) Trendlines
3) Explain trend continuation and how to spot them using market structure and trendlines. (Screenshot needed). Do this for both bullish and bearish trends.
4) Pick up any crypto-asset chart and answer the following questions -
i) Is the market trending?
ii) What is the current market trend? (Use the chart to back up your answers).
5) Conclusion.
QUESTION:1
a) What do you understand by a Trending market?

Trending Market
The word Trend is used to demonstrate the market structure and identify the market algorithm in sense bearish, bullish or consolidation (ranging) nodes which seems to be dominant features of any market whilst there are many trends which exhibits in market but these are the main and operational cores which pull the entire market in their means.
Trend basically forms by the market structure which tends to be in any direction but if the proper analysis would be done though these three can be easily enlightened in any market. Further market is based on price action held that where ever the price action travels the trending market structure would be seems, since knowing the Trending Market is positive utility of traders which can be very useful for making good profit crypto because Cryptocurrency is assumed to be highly volatile si there must be some tools to address these volatility so the use of trending market would be effective over here,howbiet professor reminded me the quote that Trend is your friend though where the trend feels better might lead you towards there.
So how positive is for us if we identify the proper trend unlikely waving in the market in its own mean how good is that if we technically use some rules and ain't violating them we can be a good trader in crypto market. As we know three main trends which market is stabilized known as
✓ Bullish
✓ Bearish
✓ Ranging
These are the mainstream which generalized the trader when he need to close the position or open the trade, since good acknowledgment of these trend might prevent us to ain't swing in means of price action and good understanding of trending market might generates fruitful results.
b) What is a bullish and a bearish trend? (screenshot required)
Means of these bullish/bearish market and their formations:
Basically markets cycle is integrated from trending market structure as we discussed the market shapes with respect to price action which produces maximum utility for traders we have to assured our trades with these, hence their multiple ways tool technical indicators and other many tricks or techniques which provides the trader visualize these market behaviour which forms bullish and bearish trends, We will discuss basic and easy formation which professor also exhibited, lets diagnose two main bearish and Bullish nodes of market.
Bullish market:

The concept of this market for remembering long term without any confusion always visualizebull and you all know the direction of bulls are always upward if they run since market is also runs in a same way if they are moving ahead means moving in upward direction, logically existence of active sellers might seen here in bull cycle. Thus where ever you see upward motion this would firmly represent upward or bullish market.
The image above might helps you understand lets look some market of bullish cycles.

Bearish market:

Opposite of bullish market the concept of bearish market also derives to judge the downward motion of market visualizing the bear hits downward resulting us the downward direction, since logically the buyers are active in nature and anticipating the price downward direction. So where ever you see downward direction remember bear and you would approach the bearish trend
The image above might helps you understand lets look some market of bearish cycles.
QUESTION:2
2: Explain the following trend identification and give an example of each of them. (Original screenshot needed from your chart). Do this for a bullish and a bearish trend.
i) Market Structure.
ii) Trendline
i) Market Structure.
Bullish and Bearish Market Structure
Bullish trend with Market structure (higher-high)
As you all aware of bullish market, simply when price move upward direction respecting the support and it should be consistent in nature thus your will acquire it. Although ut can be judge by distinguished the higher high and higher-low structure in market.
For bullish trend the price forming the higher high and higher low shaping hence the price ain't reach below the previous low point and they maintain such structure that price close above previous high point. Howbiet there you can see a positive canal for price to move upward although bulls are active over there because their presence these prevention are held. Since buyers are key players and maintain their apex in market to maintain this bullish trend in market.

Bearish trend with market structure (lower-high)
As you all aware of bearish market just similar to bullish but move in opposite direction, when price moves downward respecting the resistance level and consistent in nature thus you will acquire bearish trend. Although it can be judge by lower high and lower low formation.
For bearish trend the price form lower high and lower low price price ain't reach the previous swing high and break the previous lower low point thus anticipating the market towards consistent downward trend.

ii) Trendline
Bearish and bullish Trend line
Bullish trend with practical approach (Trend line)
This tool Trend line is one of the most convenient and easier tool to predict the market cycle, make a trend line in between upward direction make sure the price action respect the line.
Since after drawing trend line make sure the price respect the trend line aint break the line and move opposite direction won't a give you positive result hence its negative result while price respecting each time the trend line and again move upward with same consistency then fruitful results can be extract. Simple is that just do notice price action won' the break of trend line and move below thus provide you negative result if obey.

Bearish trend with practical approach (trend line)
Here also the same also the same concept to be noticed as in bullish market that the price will move below trend line and won't break the trend line might just respect the line and move downward thus good opportunity for trades to extract the downward direction.
Simple is that just do notice price action won' the break of trend line and move above thus provide you negative result if obey.

QUESTION:3
- Explain trend continuation and how to spot them using market structure and trendlines. (Screenshot needed). Do this for both bullish and bearish trends.
Trend Continuation
Trend continuation can be say an happy to wait process where traders wait until the continuation patterns obey their trend and price is likely to be in upward or downward trend, since this once pattern of price action completed might it will resume again with same trend. Held, these retracement can be profit making points for traders whole they wait for the price to move in its original direction.
So the trend continuation teaches you the phenomena whether to participate or exit from market by analysing the resultant continuation or reversal. Although if you able to analyse the trend continuation might you will be in healthy profit or this might helps non traders to participate with low price.
Trend Continuation with Market structure:(bullish)
Here the same phenomena will be implied, but the market is in the hands of buyers resulting the upward motion. Since the new low point should be lower than the previous low and new low level will be lower than previous low level.The sellers can't lift the market downward hence there is a retracement held that was the entry point for non traders. So always note the following points to visualise the bullish trend continuation:
✓ New lower level always lower than previous lower level.
✓ Above condition meets assuring buyers are weak.
✓ Keep continue your trade or sell when retracement held and price move upward again.

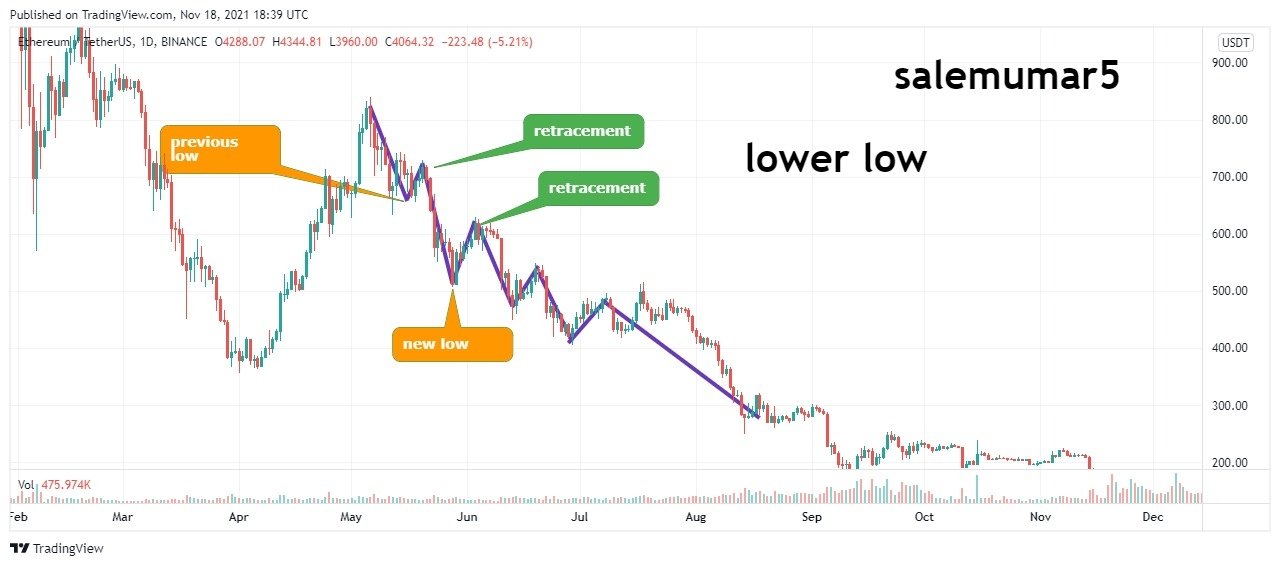
Trend Continuation with Market structure:(bearish)
For bearishMarket structure obey the higher high and higher low strategy since these impulsive retracement can be analysed by price make a high point that is lower than the previous high. The buyers can't lift the market upward hence there is a retracement held that was the entry point for non traders. So always note the following points to visualise the bearish trend continuation:
✓ High level never approach toward lower level.
✓ New low always created below previous low.
✓ Above condition meets assuring buyers are weak.
✓ Keep continue your trade or buy when retracement held.
QUESTION:4
- Pick up any crypto-asset chart and answer the following questions -
i) Is the market trending?
ii) What is the current market trend? (Use the chart to back up your answers)
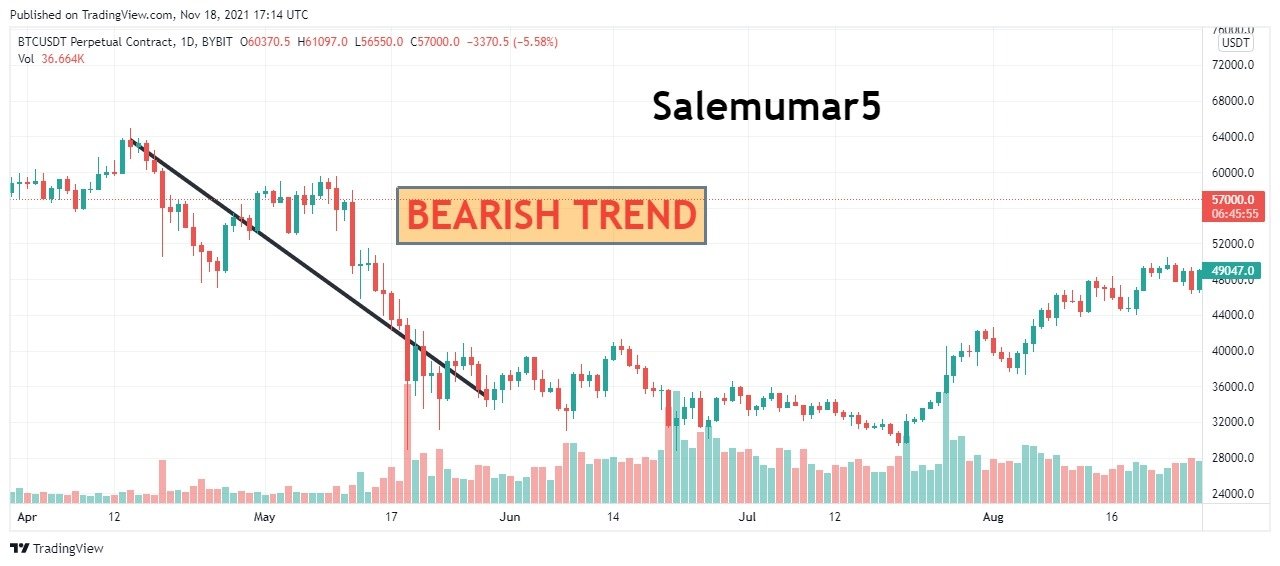
i) Is the market trending?
Here you can see market making double top and bottom but the market reaches at 60000$ held that market structure breaks and moving in downstairs. Here the marekt is in trend making higher high with bullish zone thus after a double top and not maintaining the trend rules which we study above for bullish cycle though market trend is demolished and bearish market structure can be seen after a bull run.

ii) What is the current market trend? (Use the chart to back up your answers)
Here you can see the current market trend is following the rule of bullish market with trend line and higher high i applies both techniques to make my trend more prominent. As you can see the clear higher high formation is formed further the trend line rule is also obeyed, whilst the market dynamically change its route and trend line breaks and bearish mode can be seen might it would be retracement but you can see market clearly violates both strategy thus moving in downward trend can be observed.

Conclusion
Here we had observed various types of trend in market with regulating the market structure and trend continuation in market. Although revised us the remarkable review of previous concepts of market structure, trend market and maintaining the grip of market structure with bullish and bearish trends in market. Also we discovered some of the crypto assets and their trend structure in market with trend continuation.
Hence professor taught us trend and market structure in very easy manner if beginner will review these post might there conceptual errors would be reduced accordingly.
Thanks professor for commencing such a knowledgeable lecture with us @reminiscence01.
Regards;
@reminiscence01 please review my post i ain't received any vote
@steemcurator01 review my post