Steemit Crypto Academy | Season 3 Week 2 | The Market Structure Break (MSB) Strategy to Trade Reversals
Introduction
The structure of a market in trading is described as a pattern in which prices of crypto move as shown in a price chart, reflecting the interaction between buyers and sellers. The fluctuation of price creates points that move in zig-zag form causing the movement of the market to be either upwards, downward, or sideways.
These fluctuations of price swings within the market structure are referred to as Highs and Lows, with each representing a form of market structure. The forms are associated with a combination of different swing points.
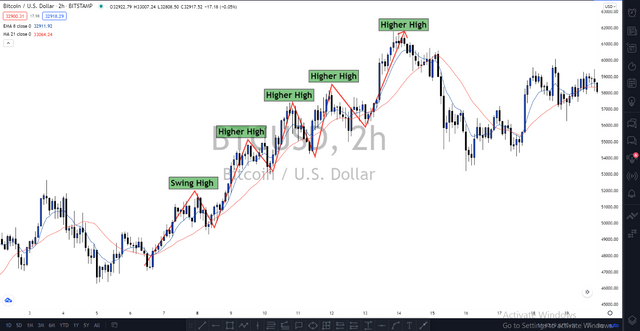
Market structure in an Uptrend
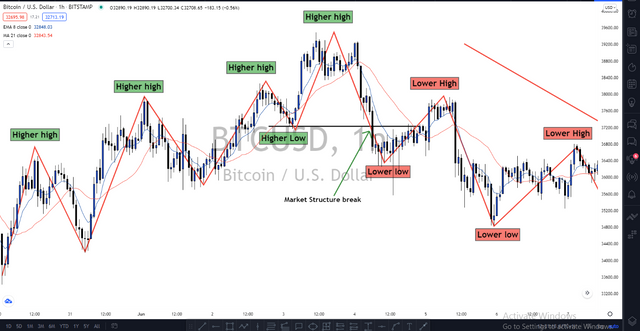
The pattern of price movement shows a continuous increase in the price of a crypto asset over time, this is made possible by the formation of Higher high and Higher low swings.
By higher high, this means that price is expected to close above the previous high, and by a higher low, implies that price will create a low higher than the previous low..

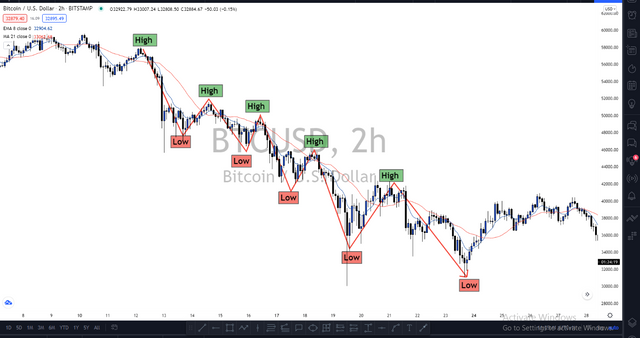
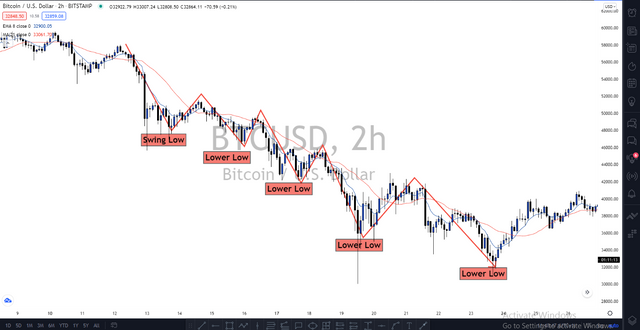
Market structure in a Downtrend
The pattern of price in this type of market structure shows a continuous decrease in the price of a crypto asset over time, this can be seen as price keeps forming lower low and lower high.
Similarly, The current high is expected to be lower than that previous high, and the current low should clearly be lower than the previous low.

What do you understand about Lower High and Higher Low? Give Chart Examples from Crypto Assets.
Higher High
This is a form of price movement pattern that is associated with the uptrend market structure, where price creates a high that is visibly higher than the previous high, creating an increasing extension in the price of a crypto asset.
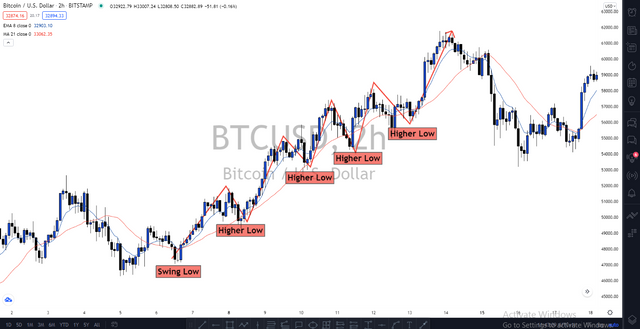
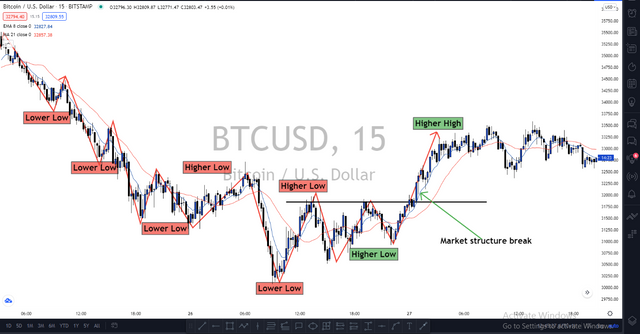
Higher Low
This is a form of price movement pattern that is associated with the uptrend market structure, where price creates a low that is visibly higher than the previous low, by this creating an increasing extension in the price of a crypto asset.
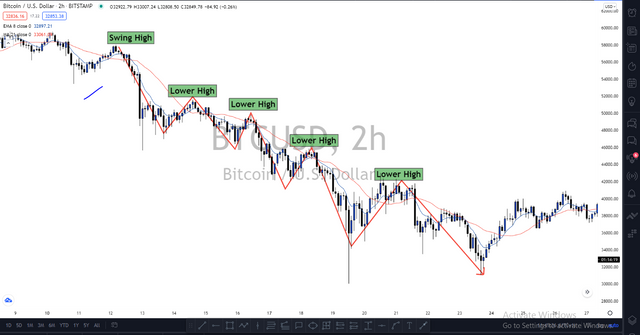
Lower High
This is a form of price movement pattern associated with the downtrend market structure, where price creates a high that is clearly lower than the previous high, and by so doing, creates a decreasing effect in the price of a crypto asset.
Lower Low
This is a form of price movement pattern that is associated with the downtrend market structure, where price creates a low that is clearly lower than the previous low, and by so doing, creates a decreasing effect in the price of a crypto asset.
How will you identify Trend Reversal early using Market Structure Break? (Screenshots Needed)
Trend reversal simply means a shift from one form of market structure pattern to the other. It is noted that the price of an asset can only move upwards, downwards, and sideways, the reversal point is the transition points hinting at the change in the structure of the market. Certain conditions in the market are to be satisfied before a trend reversal can be confirmed.
Early Trend Reversal in Uptrend
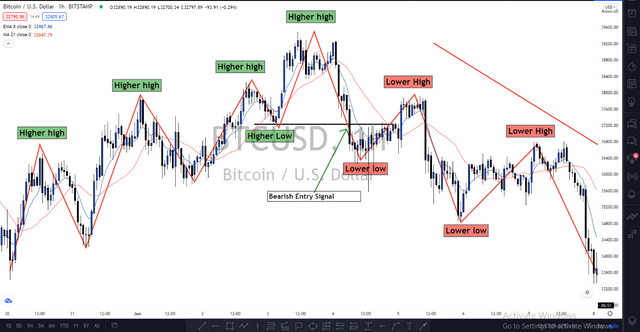
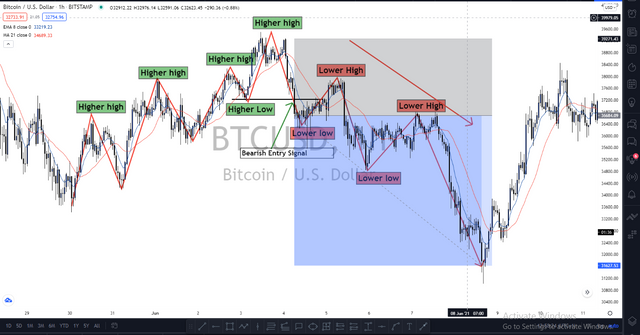
The condition to spot early reversal in an uptrend is that a form of downtrend market structure (Lower high & lower low) will form at the top of the uptrend, causing the price to break the up structure movement of price.
Early Trend Reversal in Downtrend
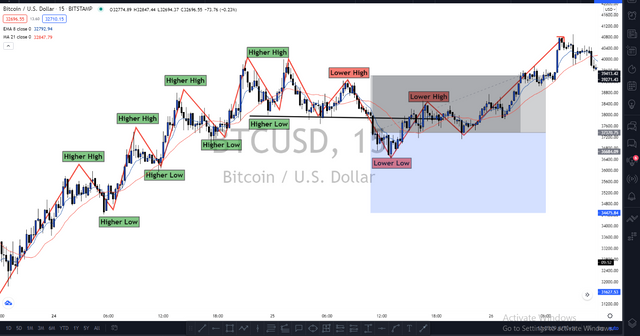
The condition to spot early reversal in a downtrend is that a form of uptrend market structure (Higher low and Higher High) will form at the bottom of the downtrend, causing a break in the down structure movement of price.
Market Structure Break Entry and Exit
Trading the market structure break strategy requires a set of rules to be established before engagement. The engagement in buy and sell situations will be explained below:
Entry Scenario:
The entry scenarios in either uptrend or downtrend include the below:-
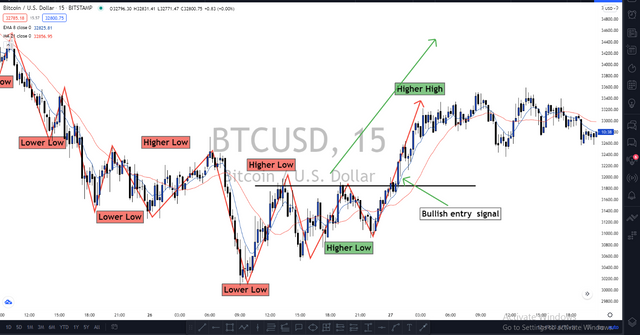
Buy Entry Situation
The form of market structure pre-established should be a downtrend since the reversal is to the upside.
Formation of uptrend market structure pattern at the bottom of the downtrend.
Candlestick bullish pattern closing above the previous downtrend structure form (Lower High).
Execute buy order at the close of the bullish candlestick pattern.
Sell Entry Situation
The form of market structure pre-established should be an uptrend since the reversal is to the downside.
Formation of downtrend market structure pattern at the top of the uptrend.
Candlestick bearish pattern closing below the previous uptrend structure form (higher low).
Execute sell order at the close of the bearish candlestick pattern.
Exit Scenario
Exiting trades can be in one of two forms, when in profit and when in a loss.
Exit in profit situation:
A profit level is a price point set to collect gains from a trade that goes in the same direction as with the planned analysis.
To exit a trade in profit using the market structure break strategy, it should satisfy the following:
A take-profit price should be determined.
The take profit price should be placed in line with market structure (areas of previous highs and lows that price is expected to retest)
The minimum risk to reward should be 1:1, at least to gain what the same ratio as what is to be lost, ex. risking $10 to make $10. A negative RR is bad and doesn't allow account growth.
Once the take-profit price is achieved, the order is automatically closed.
Exit in Loss Situation:
A stop level is a price point set to terminate an order that goes in the opposite direction as with the planned analysis. This serves as a safety net to the trader's account since it results in loss of capital.
To exit a trade in loss using the market structure break strategy, it should satisfy the following:
A stoploss price should be determined.
The stoploss price should be placed a few pips below the higher low or lower high.
The risk should be in a smaller or equal ratio to the reward, that is Risk 1: 2 Reward or Risk 1: 1 Reward.
Place 2 demo trades on crypto assets using Market Structure Break Strategy. You can use a lower timeframe for these demo trades (Screenshots Needed)
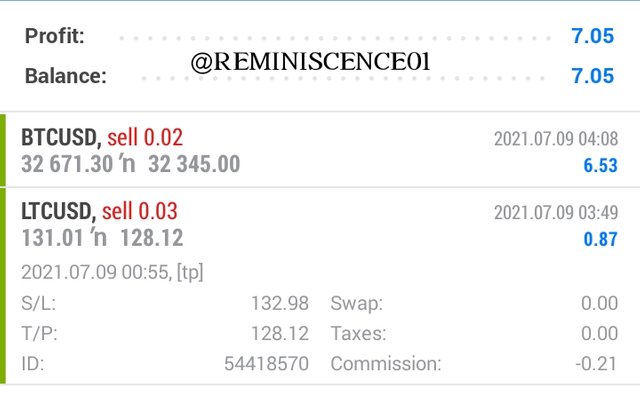
I placed the demo trades on my mobile phone MetaTrader 4 app.
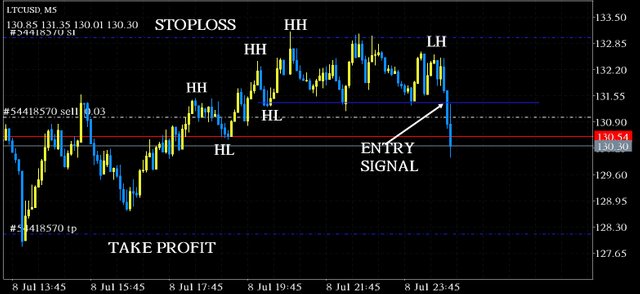
First Order LTC/USD 5 Minute chart
Looking at LTC/USD, price was in an uptrend forming higher highs and higher lows. I noticed price failed to form a new high. Whenever this happens, it is a sign that the trend is about to reverse. I waited for a market structure break at the previous low.
After some time, price broke the previous low and I executed the order after a bearish engulfing candle was formed.
Second-Order BTCUSD 5 Minute chart
I observed an up market structure pattern in the BTC chart, after long minutes of waiting, the
Lower high formed and a bearish candle closed below the neckline. I executed at the open of the next candle.
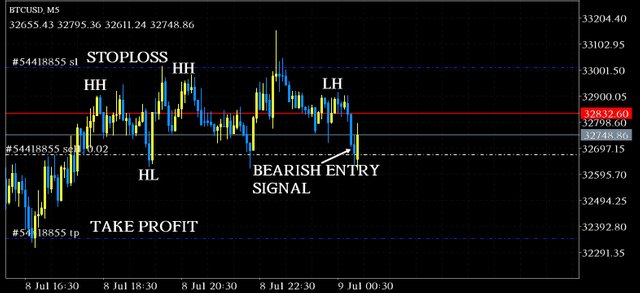
Few hours later both trades hit take profit.
Conclusion
The Market Structure Break strategy is easy to understand and use if you understand the market structure. The MSB strategy is a valuable technical analysis tool that plays vital role in riding potential trends and also spotting trend reversals.
Thank you professor @cryptokraze. It was really good to be part of this lesson.
Good day sir
Please I dropped my link 2days ago
Please grade me
https://steemit.com/hive-108451/@joelmaxwell/cryptoacademy-season3-week2-homework-post-for-prof-reminiscence01
Thank you
https://steemit.com/hive-108451/@arinzegod12/crypto-academy-season-3-week-2-beginners-introduction-to-charts-homework-for-reminiscence01
Prof @reminiscence01 u didn't mark my assignment submitted on Friday 9th of July. It was also commented on ur comment section
Pls prof @reminiscence you have to check it out