STEEM/USD Technical Outlook - 13th February, 2022 | Club75
Hello Steemians, welcome to our weekly forecast on the crypto market with emphasis on Steem/USD. Last week, we're able to carry out a technical analysis on STEEM using multi-timeframe analysis. Today, we will be looking at the current information we have on STEEM against our last analysis.
Before we go into our analysis for this week, let's look at the Total Cryptocurrency Market Cap.
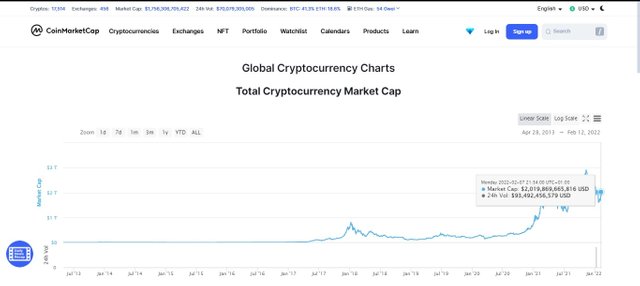
Looking at the global cryptocurrency chart above, the total market cap at the time of making this analysis is $1.9 trillion with a 24hr trading volume of 70 billion. The crypto market has recorded a gain of $200 billion this week and we can see this effect in the price of BTC $42.6k. Bitcoin still has a dominance of 41.3% over the entire crypto market and Ethereum 18.5%.
STEEM Technical Information
The information on the image below represents the technical information on STEEM at the time of making this post.
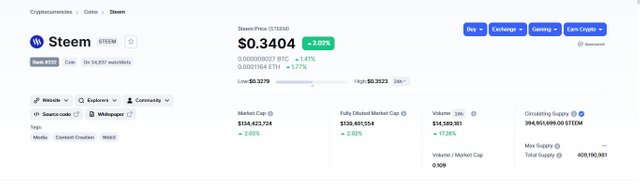
STEEM today is currently ranked #332 according to Coinmarket cap ranking. At the time of making the previous analysis, STEEM was ranked #324. The market capitalization of STEEM is $134.4 million with a 1.77% increase. STEEM price is currently trading at $0.34 with a 24hour trading volume of $14.6 million. The circulating supply is currently 394.9 million and the total supply remains 409.19 million. The maximum supply of STEEM remains hidden and this means that we don't know the maximum amount of STEEM coins that will ever exist in a lifetime.
STEEM/USD Analysis
Before we start the analysis for this week, let's look at the previous analysis we made last week on STEEM/USD. Link to previous Analysis
The chart above is from our previous analysis last week. After STEEM hit a major support level, we predicted price to retest the previously broken support which will turn to resistance.
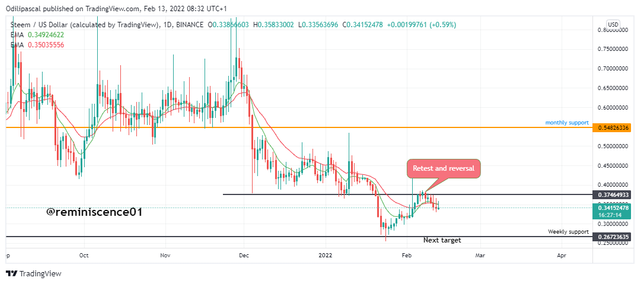
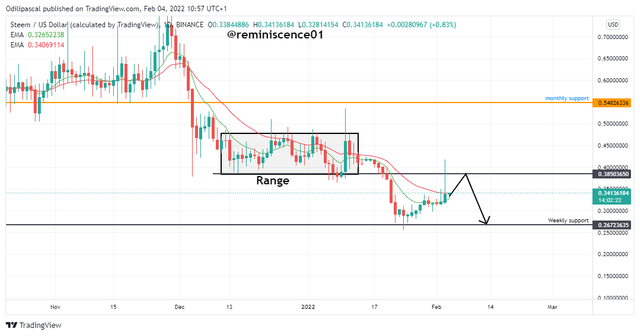
Looking at the current situation in STEEM/USD, we can see that price is following our prediction. We can see that price have gotten to the resistance level and is making progression to reverse back to the support level. Currently, STEEM/USD remains bearish as we expect price to retest the support level at $0.267.
Weekly Chart
Looking at the weekly chart, we can see a clear market structure of the downtrend. Understand that, each time a support or resistance level is broken, price always tends to retest this level to continue the original direction and that's exactly what we have here on the weekly chart.
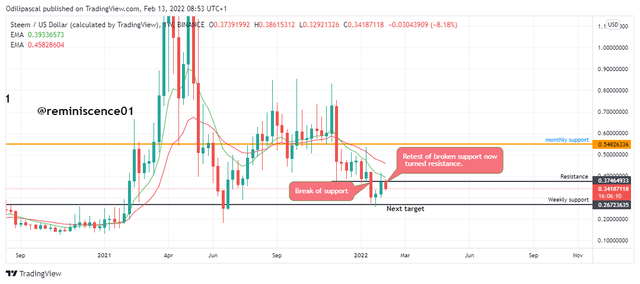
Looking at the chart above, we can see that price has retested the broken support now turned resistance. Let's go down to the daily chart to predict the future direction of price.
Future Price Prediction
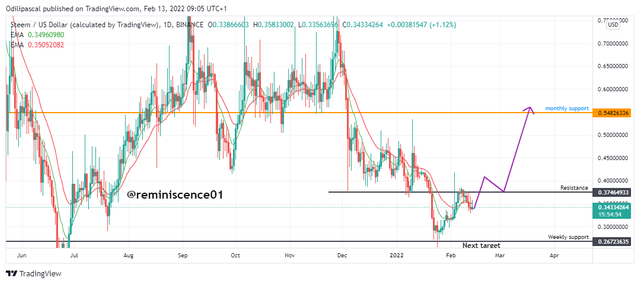
From our analysis in the previous section, we can see that STEEM/USD still has a bearish structure. Currently, on the daily chart, we can see that price has retested the broken support and it's making its way down to the major support at $0.267. If this holds, we can see price down to the support level as shown in the chart below.

Another possible scenario is that price can still reverse to break the resistance level when more buyers enter the market. This will see STEEM retest the monthly support level at $0.54. Which every way, we just have to stick to price action and candlestick analysis to react to the direction of the market. The second case scenario can be seen on the chart below.
In this post, we have carried out a multi-timeframe analysis on STEEM/USD to understand the overall price movement in the past week. From the information we gathered, we have also predicted the possible price movement using price action. Currently, the overall structure of STEEM remains bearish. This bearish setup will be invalidated when price breaks the resistance level at $0. 37.
We will be back again next week to update you on the current price situation of STEEM/USD. This analysis is mainly focused on the technical information on STEEM. As a crypto investor, it is required that you combine the technical information with fundamental factors that affect STEEM price to make a good investment decision.
Disclaimer: This analysis is not a piece of financial advice, rather it is made for just educational purposes to help you understand the price reactions to make your own analysis. Investing in cryptocurrency is very risky and it is advisable to consult a professional before making any investment decision. Also, ensure you implement proper risk management on any investment decisions you make in the market.
Cc:
@tipu curate
--
This is a manual curation from the @tipU Curation Project.
Upvoted 👌 (Mana: 1/6) Get profit votes with @tipU :)
Que buen análisis, está información es muy pertinente para quienes estamos en steemit. Gracias Profe
Thank you for your support.
Your post has been successfully curated by our team through @shemul21. Thank you for your committed efforts, we invite you to do more and continue to post high-quality posts for a chance to win a valuable upvote from our curating team and why not be selected for an additional upvote later this week in our Top Seven.