STEEM Market Outlook - A Technical Review | (#burnsteem25 Campaign )
Hello Steemians, I trust everyone is doing great today. We are here again to see how Steem price has reacted in the last week after our prediction. I'm sorry this analysis came late, I will try as much as possible to be making them on time.
The market is trying to recover from the recent dip that occurred some weeks, but it seems to have met a strong resistance stopping it from making this upward trend. Before we continue with this analysis, let's take a look at our possible predictions from the last analysis. You can find the link to the previous analysis here Steem Reaction to the market dip - Technical Analysis.
Recap of Previous Analysis

In the first scenario, we expected price to break the resistance if and only if buying pressure enters the market. Also, for this to happen we expected the recent weekly candle to close above the resistance to confirm the reversal. We will see how the market has reacted to this.
From the second scenario shown above. After price broke the support level, we expected a retest of the support now turns resistance for price to continue going down. Also, for this to happen, price needs to get rejected at the new resistance and then reverse to fill the wick on the daily candle. Let's see how the market reacted to this.
STEEM/USD Technical Analysis
This technical analysis will be carried out as usual on Tradingview.com. Before we go into this analysis, let's look at the technical parameters of STEEM from Coinmarketcap.com.

At the time of writing this post, Steem is trading at $0.271 as seen on the screenshot above. The current circulating supply of 394.951 million Steem. Multiplying this circulating to the recent prices gives the market cap of Steem which is $107.034 million. Also, Steem has a total 24hr trading volume of $37.34 million across all platforms. We have seen increased trading activities on STEEM in the last week.
Multi-timeframe Analysis
In this section, the multi-timeframe of STEEM/USD will be carried out on the Weekly and Daily charts. These timeframes are selected because we are looking at the direction of the price and not an entry opportunity to trade.
Steem/USD Weekly Chart

From our previous prediction, we expected the previous week's candlestick to either close above the broken support for bullish trend confirmation, or finds resistance and reverse to fill in the wick of the previous candle. Looking at the chart above, we can see that the previous candle failed to close above the broken support after buyers came into the market.
Now, the psychology behind this is simple. If you have been following my class from the academy, you will understand what's happening here. After the drop, buying pressure came into the market but was resisted by selling pressures. That's why price failed to break above the broken support and has now found resistance. If this resistance holds, we will see price reverse back to fill in the wick and retest the support at $0.126.
Let's have a clearer picture of the Daily Chart.
Steem/USD Daily Chart

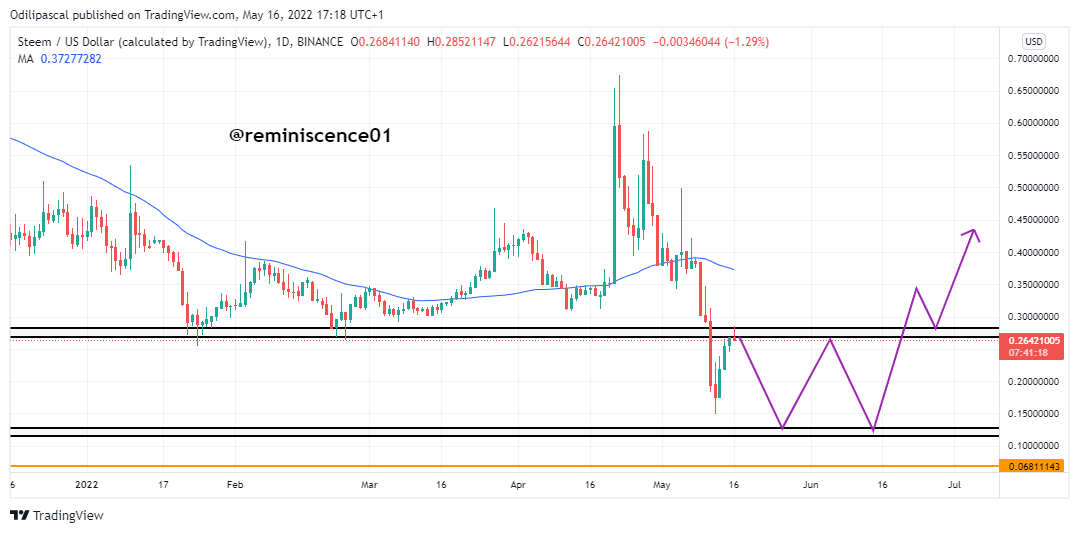
From the daily chart above, we can have a clear picture of what's happening on the weekly chart
This is why multi-timeframe analysis is very important in analysing the market. From the chart above, we can see price is reacting to the 2nd scenario from our previous analysis. Price is held at the resistance at $0.27. Notice a false breakout above the broken support, the next candlestick came back down and break below the support again. If this resistance should hold, we should be expecting price to reverse back down to retest the previous support level.
Let's look at the candlestick analysis on the daily chart.

From our knowledge of support and resistance, these are important levels of high demand and support in the market. Traders look out for price reversal or continuation at these levels. To confirm reversals or continuation at these levels, we look at the candlestick formation. From the chart above, we can see the formation of a bearish engulfing candle at the resistance which is a bearish reversal candlestick pattern. From this, we can see that price is getting rejected at the resistance. We hope to see more downward pressure on STEEM/USD.
From the analysis above, we can see that price is still bearish. Though buyers tried to take control of the market, resistance was met with selling pressures trying to reverse price. We will see how the market reacts in the coming week.
Now let's look at the possible price movement of Steem to look out for any trading opportunities.
Predicting the Next Direction of STEEM/USD
First Case Scenario

The first scenario is for price to reverse back to retest the previous support at $0.13. This can only happen when there's less demand for STEEM which will see the resistance hold price.
2nd Case Scenario

The chart above shows another possible price movement of STEEM/USD. Buying momentum can enter the market which will cause a breakout above the broken support. If this scenario happens, we can see price retest the next resistance at $0.43.
Remember what happens in the market is a result of demand and supply which affects the price of STEEM. We have analysed from the technical perspective the price movement of STEEM/USD. let's look at how the market reacts at the end of the week. We will be back again next week to analyse the market movement.
Note: This analysis is based on my personal opinion and knowledge. This is for educational purposes and not a piece of investment advice. Please do your own research and invest what you can afford to lose. The crypto market is highly volatile and risky.
Cc: @reminiscence01
Good analysis 🧐
Thanks so much.
Maybe it’s time to buy more steem 😉
Thank you. Make sure you invest what you can afford to lose.
We can afford to lose anything; even our lives. Vanity upon vanity….
Note: You must enter the tag #fintech among the first 4 tags for your post to be reviewed.
A very good analysis you have made.
I just hope the price goes in a positive manner.