STEEM Reaction to the Market Dip - Technical Analysis
Hello Steemians, I trust everyone is good and feeling the heat from the crypto market. I'm already melting in it. Well, that's the nature of the market and this isn't the first time such an event is happening. Last time, I promised to analyze the STEEM market and how it has reacted to the dip in the last couple of days. The heat is already obvious and we can see that in the debt ratio which affected the payout system 😕.
In this post, I will be analyzing STEEM/USD from the technical perspective on Tradingview.com. Also, we will be predicting the possible direction of price. This analysis is purely price action which involves multi-timeframe analysis and market structure. Students from the Crypto Academy will understand these concepts but still ride with me as I will make the analysis as simple as possible for your understanding.
STEEM/USD Technical Analysis
Before going to the analysis, let's look at the technical parameters of Steem from CoinmarketCap.
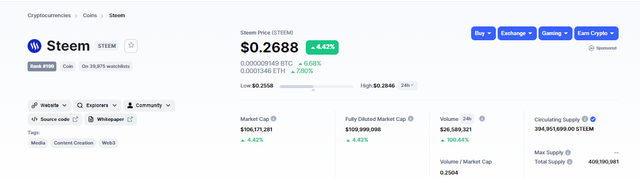
At the time of writing this post, Steem is trading at $0.26 as seen on the screenshot above. The current circulating supply of 394.951million Steem. Multiplying this circulating to the recent prices gives the marketcap of Steem which is $106.17 million. Also, Steem has a total 24hr trading volume of $26.58 million across all platforms.
Multi-timeframe Analysis
In this section, the multi-timeframe of Steem/Usd will be carried out on the Weekly and Daily chart. These timeframes are selected because we are looking at the direction of the price and not an entry opportunity to trade.
Steem/USD Weekly Chart
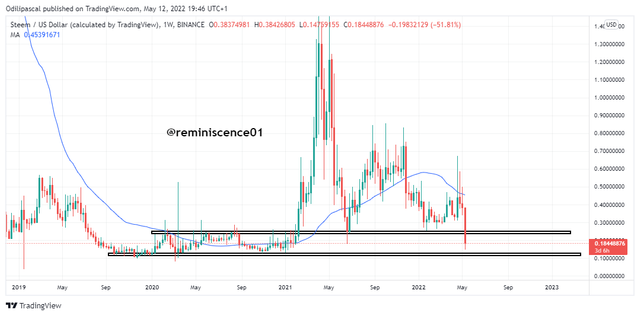
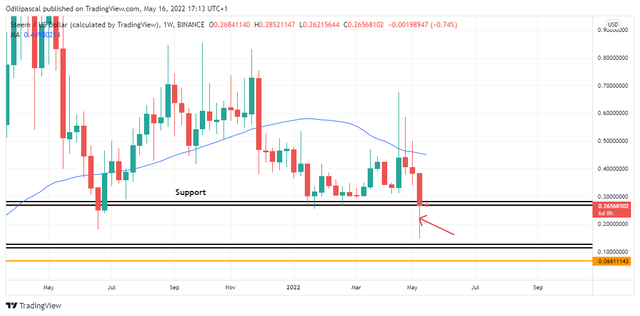
The chart above shows the weekly chart of Steem. A few days ago, I analyzed the chart above and saved it. Due to busy schedules, I wasn't able to make a post on it. But the market is moving ad expected. From the chart above, we can see that there was a high selling pressure which caused price to break the support level at $0.27. Price went further to the lowest low since January 2021.
After this strong push, a retracement is expected maybe to the broken support before the continuation of the downtrend. Of course, this will depend on the selling pressure.
Just as predicted, buying pressure came in after the dip to push the price back higher to the weekly support. The weekly candle closed at the support forming a long candle wick which is good for the price of STEEM. From previous studies, this long wick is seen as a retracement for price to continue going down. So we are expecting the next weekly candle to fill up this wick. This will be clearly seen on the daily chart.
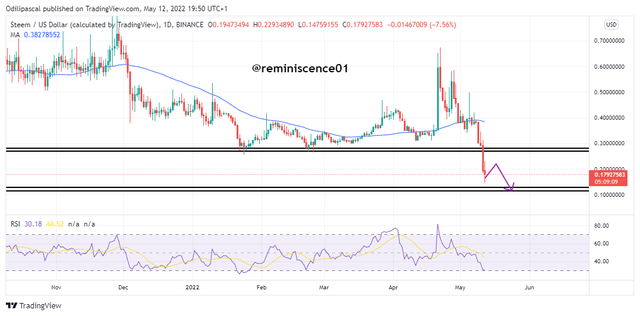
Steem/USD Daily Chart
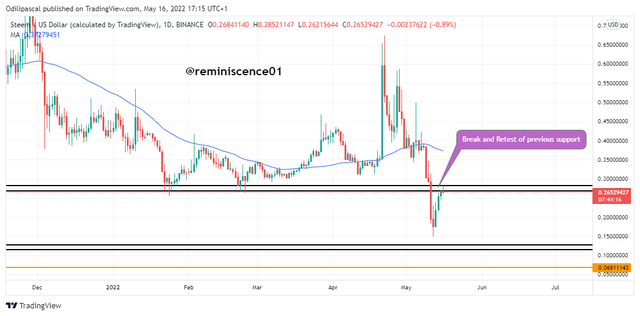
From the daily chart, we can see a clearer picture of the Steem price. We can see the break and retest of price at the previous support which was predicted previously. This is the reason multi-timeframe is essential in analyzing the market. From our understanding of the market structure, we already know that after a break of structure, price tend to retest the broken area for a continuation of the original trend.
Notice that this bullish movement on the Daily chart is the long wick created on the Weekly chart. It doesn't signal a reversal or the end of the bear market. Like I will always say in my analysis, we can always react to the market after making our predictions. Our analysis is not guaranteed because the market can always choose to move in any direction. Now let's look at the possible price movement of Steem to look out for any buying or selling opportunities.
Predicting the Next Direction of STEEM/USD
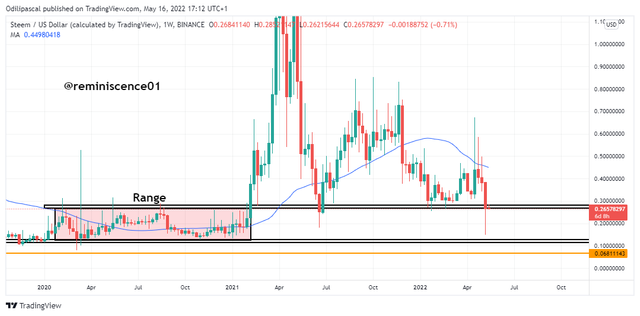
First Case Scenario
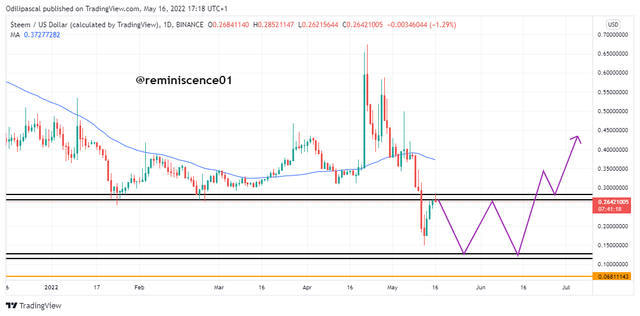
From the chart above, the previously broken support can turn into a strong resistance to hold price. If this happens, we can see STEEM back in a range before a breakout on either above or below. Of course, this depends on the supply and demand of the price of Steem. So we should look out for a bearish reversal during this retracement.
2nd Case Scenario
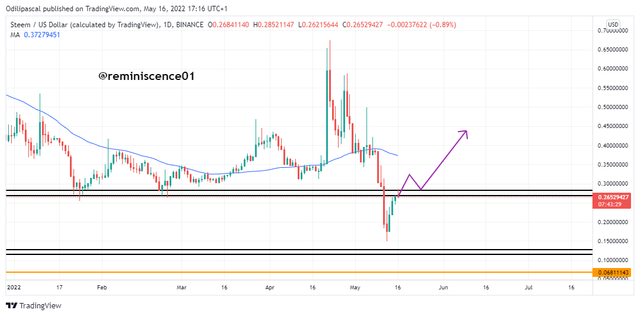
We have the 2nd possible price movement on the chart above. Of course, buying pressure can enter the market to push price back above the support. If this happens, price can surge back to the next resistance at $0.47.
The next weekly candle close will determine the direction of the market. If it closes above the support level, it means the 2nd case scenario will hold. But if it closes below the support, then we will have 1st case scenario.
So what do we do right now? Well, it's time to sit and watch the market decide.
Do not FOMO in without any solid reason. Price sitting at a support or resistance isn't a reason to FOMO and this prediction isn't a piece of investment advice. This is just a prediction of what to expect from the market. I will be back again to see how the market has reacted to these predictions.
Note: This analysis is based on my personal opinion and knowledge. This is for educational purposes and not a piece of investment advice. Please do your own research and invest what you can afford to lose. The crypto market is highly volatile and risky.
Cc: @reminiscence01
Thank you. Everyone is looking forward to a break above the resistance. Only then can we achieve $0.47.
I'm glad you found my article educative.
Note: You must enter the tag #fintech among the first 4 tags for your post to be reviewed.
Wow what great analysis prof, detailed, exhaustive and precise. Great work my prof.
I read your post sir and get an good idea. If we trade on any digital market emotion plays an important role.
Thank you for finding my article informative.
Assalamoalaikum
Sir, your prediction is accurate and i think your analysis will come true within few months because still people are thinking Bearsih trend is start but i think this will not take more time than few weeks because people understand this is buying time and who miss this time he will never see crypto in such range and steem has to rise because of it's usecase and will increase as the people rush to seemit
Hello bro. I think that you can write crypto academy work .