Homework task week5 for professor @stream4u| SuperTrend Indicator|
What is a SuperTrend Indicator?
In my last assignment on trading indicators, I explained the different category of indicators with examples. An indicator can be trend-based, volatility-based or momentum-based. You can find the article here. Trend based indicators a trader an insight into the current trend in the market. This can be an uptrend, a downtrend or when the market is ranging. Traders are always advised to follow the trend to flow with the market.
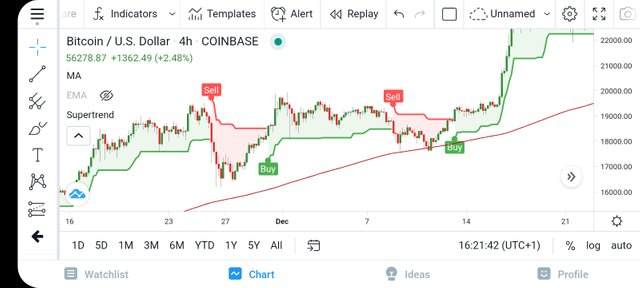
Supertrend is a trend based indicator that uses the Average true range (ATR) in its calculation to determine the volatility of the price. Supertrend indicator appears on the chart flipping red and green line. The change in line colour determines the current trend of the market. The line flips to either red or green depending on the closing price. The line flips to green when the price closes above the line indicating an uptrend and a signal to take a buy trade. Similarly, the line flips to red when the price closes below the line indicating a downtrend and a signal for a sell trade.
How to set Supertrend on the chart and the settings configuration?
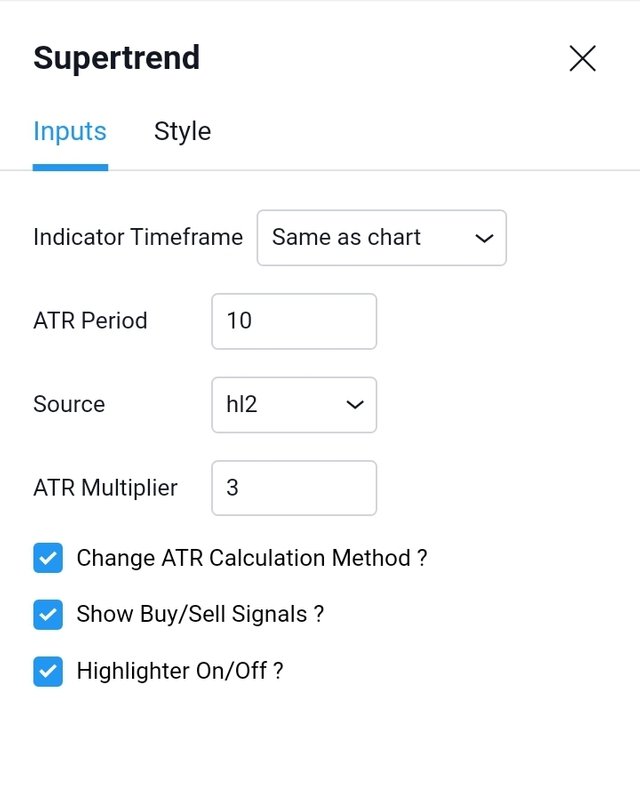
Supertrend indicator comes with ATR period 10, source hl2 and ATR multiplier of 3.
These settings affect the performance of this indicator even with the slightest changes. Similarly, changes in these settings can violate the optimality of the supertrend indicator and might make it to give false signals.
Steps in setting Supertrend on the Chart.
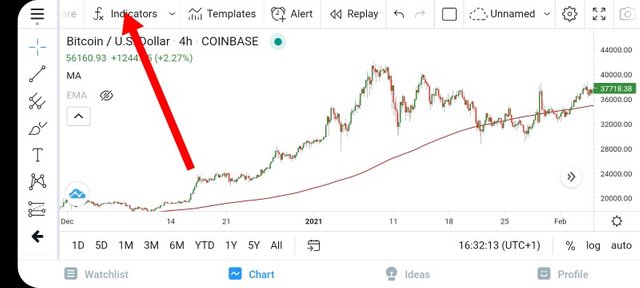
-Open your chart and click on indicators
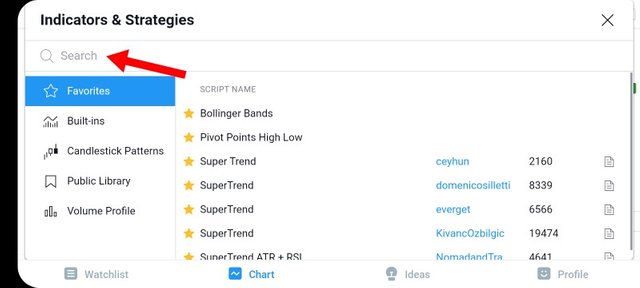
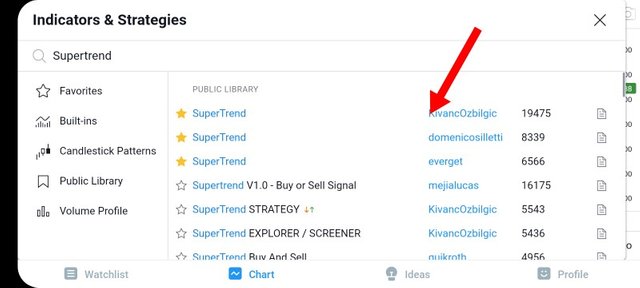
- A dialogue box appears with various functions. Just go to the search bar and type "supertrend".
- There is a lot of supertrend indicators that will pop up from different source. Select the supertrend indicator by KivancOzbilgic. SuperTrend indicator appears on the chart.
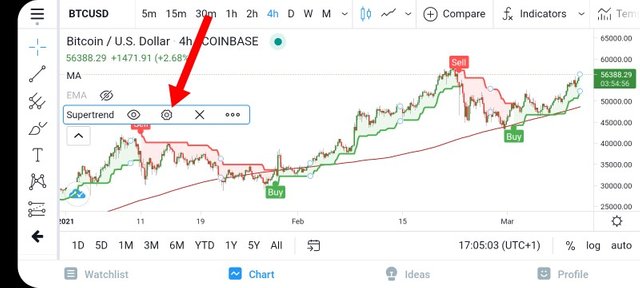
- On the chart, the indicators panel is showing different indicators used by the trader, click on SuperTrend and select the settings icon to input the parameters explained above.
How SuperTrend shows buy and sell signal?
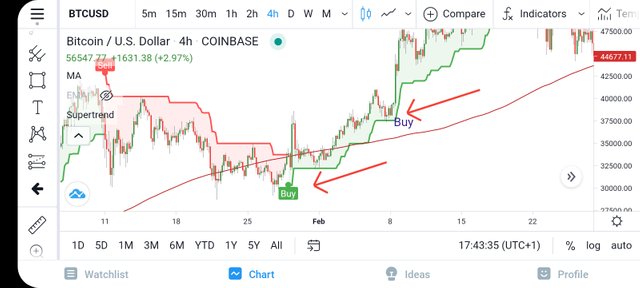
SuperTrend indicator flips red and green colour line to indicate the current trend in the market. Traders can capitalize on this to make buy and sell entries.
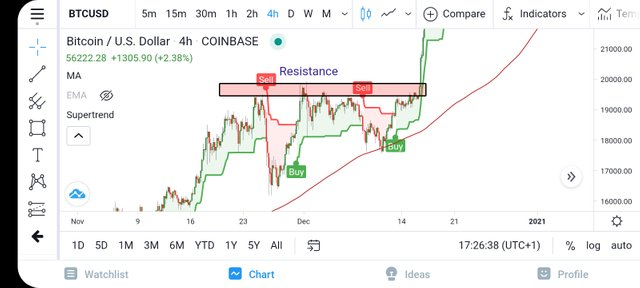
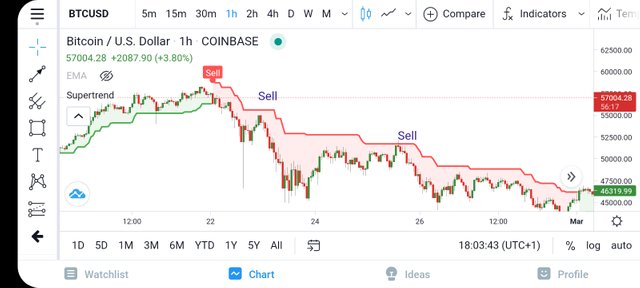
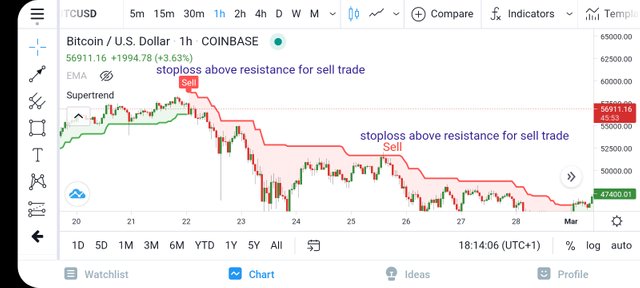
When the colour changes to red, Supertrend is indicating a reversal in the current trend for a sell signal. A better confirmation to take a sell trade is when the colour change happens at a resistance price level.
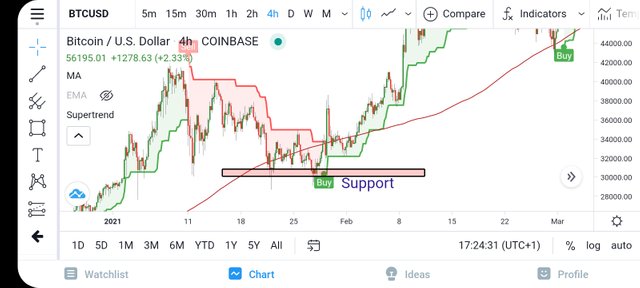
Similarly, when the colour price changes from red to green, SuperTrend is indicating that there's a reversal of the current trend to the upside. Traders can take a buy position when this colour change happens at a support level.
When we can place a buy trade with the help of the SuperTrend indicator?
SuperTrend shows a buy signal when the colour line changes to green and the current price of the asset is above the supertrend line. Wait for price to get to a support level of the supertrend line for a buy entry.
When we can place exit/ square off, sell order with the help of SuperTrend?
SuperTrend indicator shows a sell signal when the colour line changes to red and the current price of the asset is below the supertrend line. Wait for price to get to a resistance level of the supertrend line and take a sell trade.
How false indication look on SuperTrend?
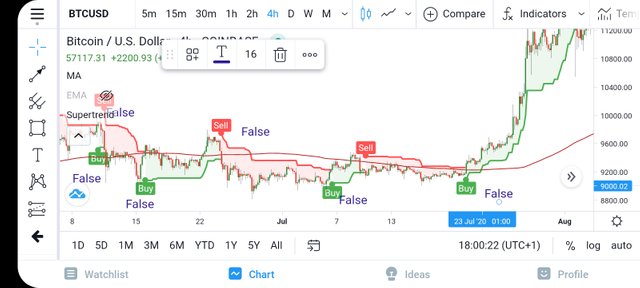
Indicators are not 100% accurate in giving buy/sell signals. Sometimes they can give false signals against the current trend in the market. In the Supertrend indicator, false signals appear when the indicator gives a buy signal and a corresponding sell signal after a very short time.
Stoploss suggestion using Supertrend
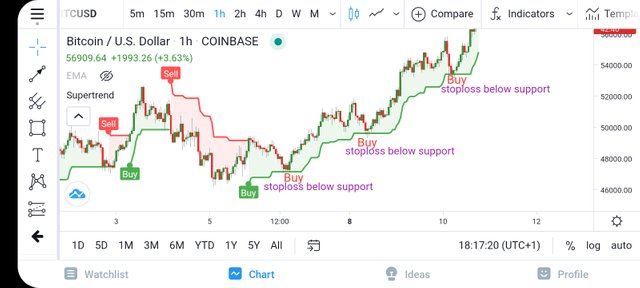
Stoploss helps us protect our account when our prediction goes wrong. Just like an indicator can give a false signal, placing a stop loss will help you to cut your losses on time. In supertrend, I suggest stop loss should be placed a few points above the supertrend resistance or support line.
Conclusion
SuperTrend is a powerful indicator that tells a trader the current trend in the market. It is very simple to use and can show a trader when to buy/sell. Just like every other indicator, Supertrend can mislead a trader by showing a false signal. Therefore, a trader must wait for the price to get support and resistance level before taking an entry.
Thank you professor @stream4u for this amazing lesson.
Special thanks to:
Cc:@Steemcurator01
Cc:@steemcurator02
Cc:@stream4u
Cc:@trafalgar
Hi @reminiscence01
Thank you for joining Steemit Crypto Academy and participated in the Homework Task 5.
Your Homework task 5 verification has been done by @Stream4u.
Thank You.
@stream4u
Crypto Professors : Steemit Crypto Academy
Thank you Professor @stream4u. I always enjoy your lessons.
Twitter promotion