Crypto Academy Week 10- Homework Post for Professor @stream4u on Price Forecasting
Hello Steemians, I'm happy to be here today to participate in this wonderful lesson delivered by Professor @stream4u on Price Forecasting. The lesson was very educative and simple for a newbie into cryptocurrency to understand.

What is Price Forecasting?
We all know the high volatility nature of cryptocurrency and it's not something anybody wants to joke about when trading cryptocurrencies. As a cryptocurrency trader, it is required to be prepared for the market because if you don't make the right decisions, your trading capital will pay for that. Price forecasting is the process of predicting the direction and behavior of the current price of an asset and the future price of the asset.
Discuss why Price Forecasting is needed?
As cryptocurrency traders, we trade to make profits by predicting correctly the direction of the market. We make money when our reduction is correct and lose money when our prediction is wrong. Similarly, even when every indication is telling you to buy, you don't just jump into the market and hit the buy button, you need to get a good entry point to make good profits. Similarly, when we enter a position, we don't know how far the price will go before retracing back to our entry position and we don't intend to hold trades forever. Price forecasting is very important in making a good trading decision. Here is the importance of price forecasting:
- It helps to predict the direction of the market.
- It helps to get a good entry position.
- It helps to know when a trader needs to close a position.
- It can help minimize losses by indicating when there's instability in a particular price.
- Price forecast can help a trader in making good risk management. With a price forecast, a trader can be able to know when to use lower capital or big capital on a position depending on the information from the price forecast.

What Methods are best you feel for Price Prediction/Forecasting.
In trading, there are so many tools and strategies available for making price forecasts. Chart patterns, support, and resistances, economic news, volumes in the market, trader’s outlook, etc. But all the strategies and tools used in price forecasting fall into any of these three methods:
- Technical Analysis.
- Fundamental Analysis.
- Sentimental Analysis.
Technical Analysis
Technical analysis is a price forecast method that utilizes historical and statistical data to predict the future price of an asset. Technical analysis deals with using the market statistics and previous information like chart patterns, indicators, volumes, support, and resistance to make trading decisions. Technical analysis involves using past price actions and technical indicators based on previous price statistics to predict the future price of an asset. This can be chart patterns, candlestick analysis, use of indicators, volumes, multi-timeframe analysis, etc. in price forecasting. For example, when a double top is formed in the market, this is an indication that the price is about to reverse in the opposite direction. Similarly, when a bullish engulfing candle is formed at a support level, it is an indication that the price of an asset is strong to the upside and traders should look for a buying opportunity. Technical analysis deals with using the previous and current price action of an asset to predict the future price of the asset.
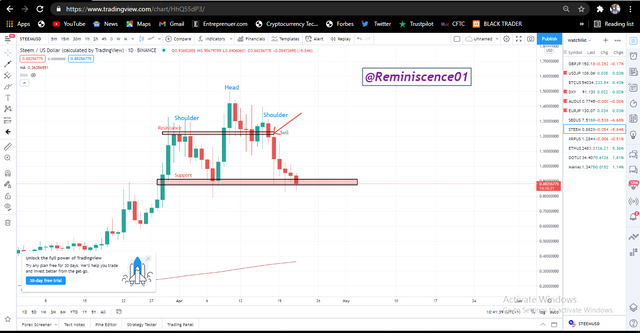
The picture above is the Chart of Steem/USD. From the chart, when I noticed a head and shoulder pattern formed on the chart, it indicated that the price is about to reverse to the opposite direction (Sell). Another confirmation for the sell trade is when the price closed back after breaking the resistance. That indicates that sellers are in control of the price you should be looking to close your position if you are on buy. This is an example of technical analysis using chart patterns, support, and resistance to forecast the future price of an asset.
Fundamental Analysis
Fundamental analysis deals with looking at factors outside the current price of an asset or chart to predict the future price of the asset. In fundamental analysis, economic factors like market supply and demand, new deals signed by the company, announcements on the asset, political factors, etc. are used to predict the future price of an asset. In fundamental analysis, the performance and development of the company are focused on to predict the price of the assets. For example, let's assume the Bank of England strikes a deal with the Ripple network for banking services, this will potentially pump the price of XRP to the upside. You don't need to look at the chart to know that this is a good time to buy XRP. Similarly, earlier this year, we saw the price of XRP dip down due to the SEC suit. Some exchanges suspended the trading of XRP on their platform. As a trader, this kind of news is an indication for you to know that XRP is going to be weak and you need to close your positions or sell XRP. In these examples given, you do not need the chart or technical indicators to predict the future price of the asset.
Sentimental Analysis
Sentimental arise as a result of assumptions from traders. These assumptions can create panic and volatility in the price of assets. For example, when you enter a popular discussion group and notice that everyone has the same bias (Buy or Sell) on a particular asset, most of the people there are professional traders and you might not want to go against the crowd. When everyone is bullish on a particular asset, it can create volatility for the price to go bullish on the assets.
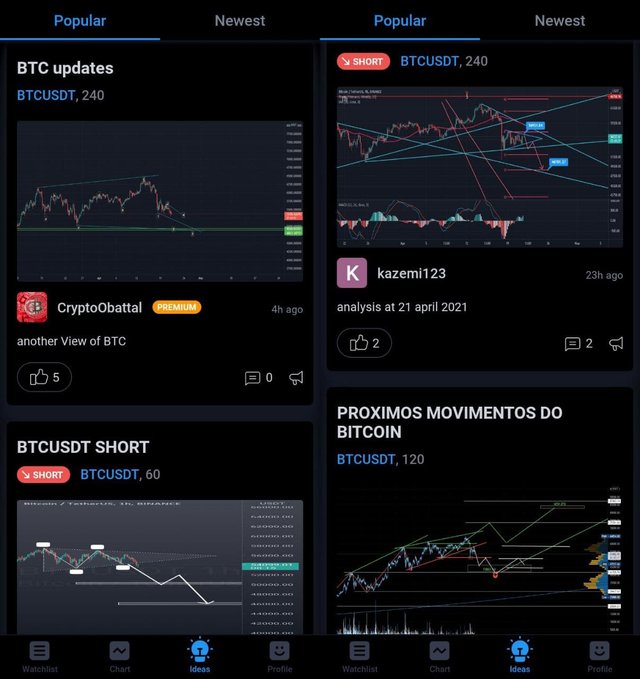
The picture above shows Tradingview ideas interface. This is an interface where traders post their analysis and ideas on a particular pair. From the picture, we can see different ideas from other traders on BTC/USD. Most traders come to this platform to know what other traders think about the pair and make their own decision. You might not want to sell an asset when everyone wants to buy. Similarly, traders seek trading ideas from popular blogs, forums, tweets, discussion groups to predict the price of an asset. Another example can be seen when Elon Musk tweeted about DogeCoin, the tweet alone created panic and volatility in the price of DogeCoin and so many traders will go long on DogeCoin because of the support it has from Elon Musk.
Take any Crypto Asset Chart graph and explain how to do Price Forecasting? OR Take any Crypto Assets Chart graph & as per its current price tell us what will be its future price for next 1 week or 1 month? You can predict for any direction up or down but explain it properly on what basis you have predicted the price.
I will perform technical analysis on BTC/USD to predict the future price of Bitcoin. This will be performed using a Chart of BTC/USD in Tradingview. In this analysis, I will perform a multi-timeframe analysis using basic support and resistance, chart patterns, trend lines, and candlestick analysis to predict the price of Bitcoin.
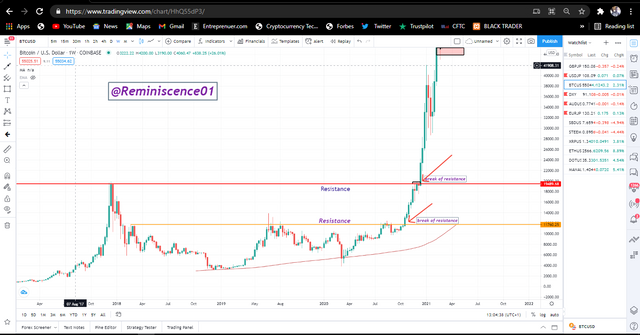
The chart above shows the weekly chart of BTC/USD. We saw price break resistance at $11760 and traded higher. Price continued in an uptrend and broke the all-time high of BTC/USD at $19489. This break of resistance shows that the uptrend is really strong and we can that on price forming huge bullish candles. So from the weekly chart, we already know the direction of the market that the trend is up.
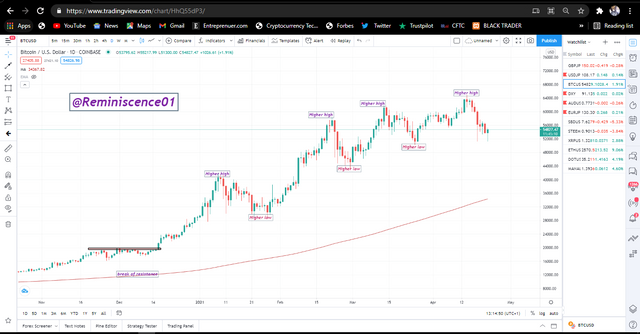
From the weekly chart, we know that BTC is in an uptrend which can be reflected from the daily chart as the price is forming higher high patterns. Similarly, we can see that price have been trading above the 200 moving average which is also an indication that we should be looking for a buying opportunity.
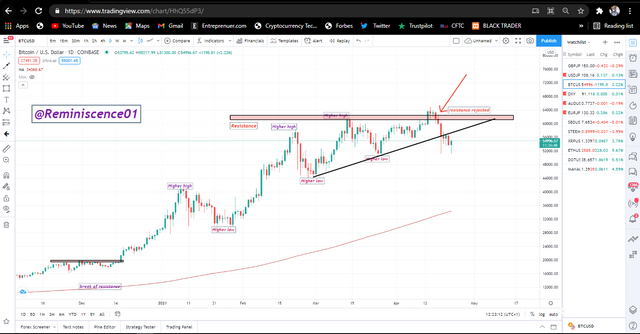
From the chart above, after the bullish rally on BTC, we saw the market taking a break, and resistance was created on the 12th of March at $62K. From what we are seeing in the chart above, the price retested the resistance again on 15th April and was failed to break it. This shows that there is selling pressure as buyers have failed to break the previous high. Similarly, from the overall direction of the chart, BTC is still in a bullish trend.
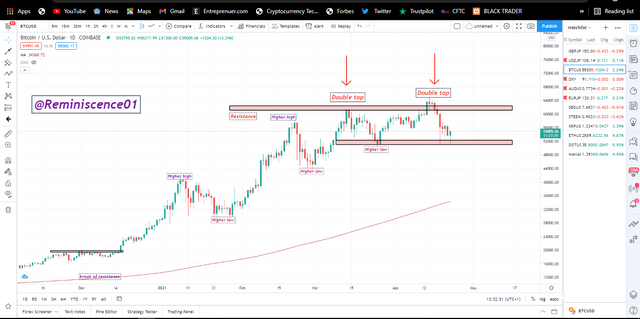
From the last chart, we can see a price rejection at the resistance level which is a sign of reversal of the trend. Similarly, from the chart we have above, we can see a formation of a double top pattern which is also a sign of reversal of the current trend.
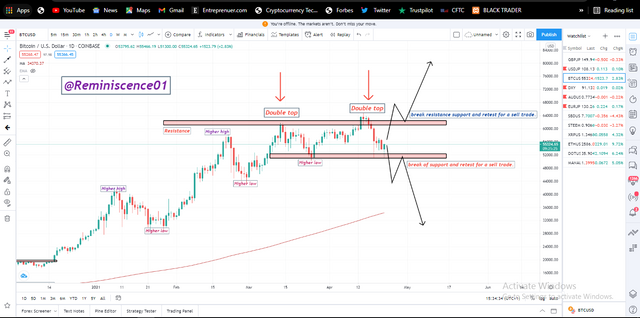
Though we have seen a price reversal pattern via a double top and price rejection at a resistance level, we can't just take a sell because, from the chart, BTC has been in a range since 14th March 2021 bouncing off support and resistance between $50K and $62K. My prediction now is that BTC is in a range bouncing between support and resistance. Some traders might still capitalize on this range by buying at the support and selling at the resistance. But the best approach for me is to wait for the price to break out of this range before taking either a buy trade or sell trade. A break of the support will signal a sell trade, while a break of resistance will be a continuation of the original trend.
In conclusion, price forecasting plays an important role in making a trading decision as a trader. Nobody wants to be wrong in predicting the direction of the market because your capital will pay the price. Cryptocurrency trading is very risky due to high volatile nature of the market. A trader needs to be prepared in both technical, fundamental, and sentimental analysis as these methods are needed to make a successful trading career.
Note: All pictures used in this post are screenshots taken from my tradingview account unless states otherwise.
Thank you Professor @stream4u for this wonderful lesson.
Twitter Promotion
Hi @reminiscence01
Thank you for joining The Steemit Crypto Academy Courses and participated in the Week 10 Homework Task.
Well said.
Your Week 10 Homework Task verification has been done by @Stream4u, hope you have enjoyed and learned something new.
Thank You.
@stream4u
Crypto Professors : Steemit Crypto Academy
Thank you Professor @stream4u. I really enjoyed the lesson.