#burnsteem25||Steemit Crypto Academy Contest // S4W1 - Crypto Market Technical Analysis by @rafk
Welcome to the season 4 engagement challenge dear steemians. I'm happy to be engaging with you guys again after a short break. Today, I bring to you my entry on this amazing topic carefully selected by Steemitcryptoacademy team which state: Crypto Market Technical Analysis.
The crypto market has existed over the past year and up till present. A lots of things need to be review when we discuss of the crypto market. What happens in the market is people invest in the market base on some sort of calculation known as Technical analysis or maybe fundamental analysis.
Not to waste much time fundamental analysis will be a topic for another day, so right away we're focus on Technical analysis. The word analysis means detail and collective examination of anything or something. Talking of technical analysis , short TA, we will find out now.
| Definition of Technical Analysis In The Crypto ecosystem And Its Importance. |
|---|
Technical analysis is a process of weighing and examining the market chart back in time and using the data to predict the future of the market. Technical analysis is brought about with the help of mathematical indicators which work by simulating the price action of the market and produce some signs to tell the direction of market movement.
Since the market mostly work on repeated price action, technical analysis, used pre-existing market charts and compare them with recent happening in the market and this is brought about with some indicators which we will soon see.
In 2021 market analyst predicted that the price of Bitcoin will have a high of $70000 and market may rise up to a $100000(HH) and if it fails, we might have a low of $19000(LL) by the end of 2022. And this predictions have 95% been accurate.
We have see BTC rise to near $70000($68k) and presently the current volume is around $19000- $20000. All this speculations came as a result of analysing the chart from 2010 to 2017 and comparing the pattern of the various charts to predict the future. 2023
| Importance of technical analysis |
|---|
Technical analysis have been more efficient of the past years since it discovery and it have covered a wide range of importance as I will state some here.
With technical analysis, investors, potentially traders are aware and more efficient in their trades. Performing technical analysis on a trade, traders know just when to Buy, Hold or sell out of the market. This help present losses .
Technical analysis also put traders on alert with the help of some indicators which trader/investors can spot and predict exactly the next outcome of the trade.
With technical analysis investors can repeated rely on some sort of repeated pattern to maximize their profit in the stock market.
In the Cryptomarkets some price fluctuations are difficult to predict like the recent BTC and related currency are fluctuating currently.
Technical analysis help investors to spot support and resistance in the market with ease.
Technical analysis benefit are numerous and won't stop but this most relevant point support it all.
| Do I have practical knowledge of how to conduct technical analysis? point out some of the components of Technical analysis. |
|---|
The principles one need to know before applying technical analysis in the market are:
- The market move within ranges of expansion and contraction,
- Trends are likely to continue more than reversals,
- The momentum of the market precedes the price and
- Trends turn to end in 2 ways, A continuation or rollover.
After having the principles one need to come up with a better trading strategy with work for himself. We should bear in mind that the market is so volatile so picking a trading plan should be that which favours the nature of the market.
It's trading time!..Using your strategy, it's advisable to use candlestick charts as they show more information on price action and going in for few indicators which will help you confirm your decisions. After a trade, evaluate your strategy and get it right or do modification since the market swings often time(volatility).
Various Components of Technical Analysis
As trader we ought to know that technical analysis can best be carried out with the help of various components which I now list them below.
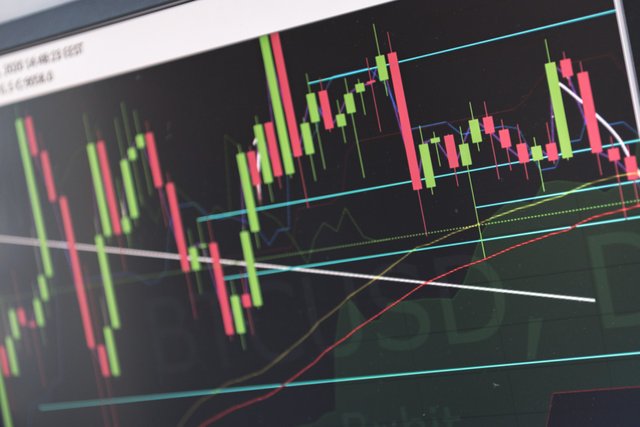
As previously said tradingview takes place on a chart and the best of chart to use is the candlestick chart as it present more information about the price movement. Each candle represent a particular time frame. It depends on the trader which time frame he uses.
Support and resistance occur in the market which are price levels the the market can break easily . A support simply stop the market from going low while resistance stop the market from going high.
Indicators are more important when using Technical analysis as it helps us determine the price action of the market at a particular instance. Traders are advice to go in for indicators they are verse with and use just a few.
| What do I understand by technical indicators? Do you consider them effective for trading cryptocurrency? Which one is My favorite and how does it work? (Screenshots required where necessary) |
|---|
| Indicators | category. |
|---|---|
| Trend indicators | MA, ADX and Ichimoku Indicator |
| Oscillator Indicator | RSI, Stochastics, CCI and MACD Indicator |
| Volatility Indicators | Bollinger Bands and ATR Indicator |
| Support/Resistance Indicators | Pivot Points and Donchian Channels |
Are Indicators Effective In Trading
To keep it short, Indicators are effective in trading if the trader has master them well. I will take an example on myself, some time just looking at the chart I can quickly predict the market direction, trends and resistance but it's guess work.
Indicators help me confirm my predictions and most eventually the market goes as I predicted. Which is much easier to confirm with an indicator.
Which one is My favorite and how does it work?
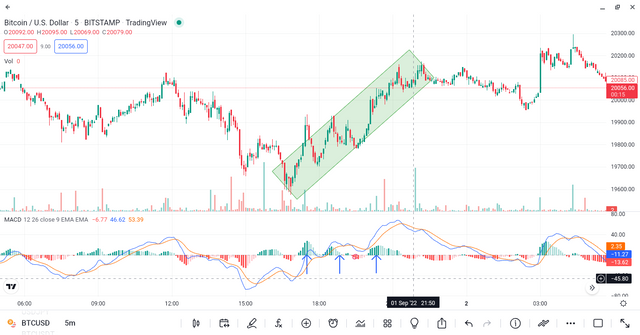
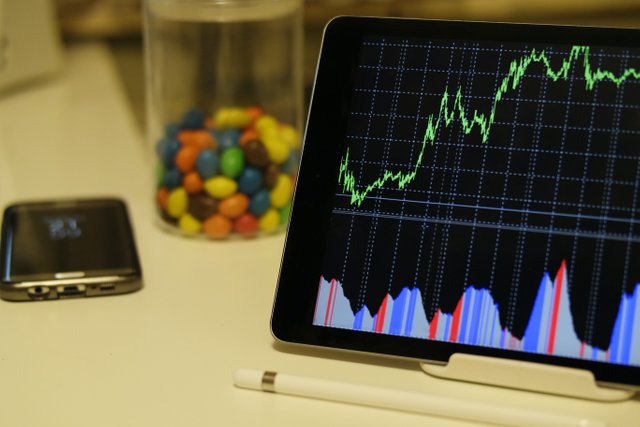
My favourite indicator is the MACD indicator which falls under the category of oscillators indicator. MACD is very simple to use as it helps me determine the volume and the momentum of the price action.
It function by specifying the difference between the 26 days EMA and 12 days EMA on the chart. The 12 days run faster than the 26 day EMA. MACD determine the strength or weakness of a downtrend or an uptrend.
On a downtrend , the red spike pattern is more concentrated below the neutral line and the reverse happens an uptrend . From my chart above as indicated you can see that the volume is concentrated above the neutral line. And the results is an uptrend.
Equally on resistance /support level. The spikes a concentrated on the neutral line and at this point it's not advisable for me to trade.
| Highlight The Advantages And Disadvantages Of Technical Analysis. What's My Advice To Anyone About It? |
|---|
Technical analysis like any other tool have it advantages and well as limitations which I will list out now.
Advantages
- Due to the volatility nature of the market, a trader can quickly use technical analysis to divert between price momentum
- it's easy to inquire and saves a lot of time,
- It implement better learning technics ,
- it is cost efficient.
Disadvantages.
- The theory of history repeating itself doesn't occur in the same way all the time, the market often divert at time.
- Technical analysis in some ways can produce inconsistent results.
- Charts which could be analysis in a fundamental and actual way are neglected by technical analysis.
If I could advice someone ready to use technical analysis it will be short and simple: the person should do more research, be dynamic in the market, use a better strategy which works best with technical analysis, review my components of technical analysis and that's a big step forward.
| CONCLUSION |
|---|
To conclude , I will say technical analysis a great tool in the trading market and better knowledge of it produces great results. It's quite simple to understand, follow the principle, component of technical analysis and your success is guaranteed .
Note: Technical analysis is more efficient in short term trades, if you desire long term trades you will invite fundamental analysis coupled with technical analysis.

| 25% to @null |
|---|
I think if technical analysis should be deleted from trading now trading might stop😃😃(just an aside).
really wonderful content you've put up here bro
Thank you
This is a really nice post. I enjoyed how you talked about the MACD indicator.
Thank you sir
Thanks for sharing with us.
you're welcome !!
You've simply touched the whole part of the contest in a fantastic manner.
These are well explained and the demonstrations are spot on, I love the markdowns and all, I wish you good luck in your entry.
thank you so much for your time and patience sir.
Muy buena presentación sobre el análisis técnico amigo, el MACD también es uno de mis indicadores favoritos me alegra ver qué alguien más lo usa!
Suerte en el concurso, saludos
Thanks for your support ma'am 😊
A good looking post which also read easily!
Well done!
As for the content. I’m not familiar with what is expected from the challenge but what you have written was enjoyed by me.
Keep on writing ✍️
Thanks so much for your support 😊
Pleasure!
Well, this what psychology is based on that the market repeats itself, some though do not believe this statement but in life we should make assumptions sometimes.
Yeah, we should always backtest our trading strategies on previous price reflections before using it on current market as we are putting our resources on the line.
The high chance of surviving with technical analysis depends on the traders knowledge.
Please find time to visit my post as well. Good luck!!
https://steemit.com/hive-108451/@sadiqxylo/steemit-crypto-academy-contest-season-4-week-1-crypto-market-technical-analysis-by-sadiqxylo
Good evening friend,
Yeah, you are right it really helpful in market analysis, helping traders become much more technical with their prediction. Although it's no 100% assured of success but it's has proved to have remarkable influence in the success rate of traders,
thanks for sharing
wishing you success