Steemit Crypto Academy Contest / S4W1 - Crypto Market Technical Analysis by @preye2 (#Burnsteem25)
Designed on Canva

I greet you all according to your time, I will start by commending the Steemitblog team for their success so far in respect to the Engagement Challenge, it has really been an awesome journey.
In this article, I will be sharing my views and understanding on a very important aspect of crypto trading (Technical Analysis). It's very important to note that every successful crypto trader today must have a forecast knowledge of the asset he/she wants to trade with the help of past market charts. Below are some important details we should know about technical analysis in cryptocurrency trading.
Let's get a clear understanding about the two keywords used here;
Technical: This involves having a unique, clear and practical knowledge about a particular subject.
Analysis: This refers to the act of carefully examining and getting a clear understanding about a particular concept, usually with the help of statistical data.
Technical Analysis in simple words refers to the careful and practical studying, evaluation, examination and prediction on the future price movement of a tradable asset/assets with the help of available market data as well as historical trading charts.
This assets could either be Cryptocurrencies, Stocks and Commodities, but in this article we will be dealing mainly on cryptocurrencies.
After multiple research and observations, experts have come to realize that the previous statistics of price movement can go a long way in predicting the future behavior of price movement. And so far, it has been confirmed by many traders that this strategy is the key to a successful cryptocurrency trading adventure.
A successful technical analysis is usually done using some basic trading tools/strategies like:
- Technical Indicators
- Time Frames
- Candlesticks
- Volume change
- Accumulation & Distributions
- Support & Resistance line. And many more...
As I said earlier, traders who correctly conduct technical analysis gets to accurately predict the future outcome of a market trend and equally know when to enter into a trade.
Below is a highlight on the basic importance of technical analysis
- it helps a crypto trader to decide when to buy, hold and sell his/her assets.
- In most cases, it helps traders to realize Profits from their traded assets.
- It helps a trader to know the current psychology of market participants.
- It equally help traders to correctly identify support and resistance zones.
Once upon a time, I had no knowledge on technical analysis because I could remember my early trading days, when I went into the crypto market with my emotions instead of proper analysis. I would quickly place my buy orders when I see that the price of an asset is rapidly going upward because I was afraid of missing out on any possible profits. But I later realize that I was losing lots of my asset because of poor risks management strategies and no technical analysis.
Nevertheless, I began attending the crypto trading lessons that was organised every week in the Steemit Crypto Academy and luckily for me, I meet intelligent and experienced professors like @pelon53 and @imagen who taught me about technical analysis, and how to practically conduct it. After going through the classes and performing some homework tasks, I can now confidently say Yes, I have practical knowledge on how to conduct technical analysis.
Some of the major components of technical analysis includes:
1. CHART: This refers to the pictorial and graphical representation of the price data of an asset over time.
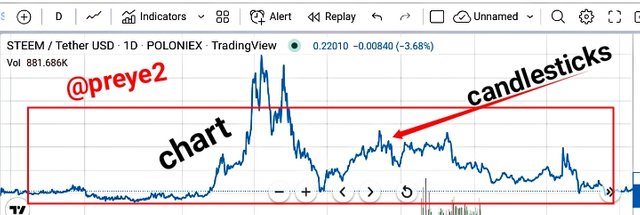
As seen in the screenshot above, the chart uses candlesticks to shows the summary of price data(transactions made) within a specified timeframe.
2. VOLUME AND PRICE STATISTICS: Here price statistics refers to the agreed cost in which both parties decides to transact at. And Volume is the rate of market engagement from market participants within a specified period of time.
.jpg)
As seen in the screenshot above, this is the representation of the rate of market participation within a specific time frame.
3. Indicator Tools: This refers to a mathematically designed tool that usually calculates the previous price/volume data and then give a clear prediction of the future movement of the trend. Examples of such indicators includes: Relative Strength Index(RSI), On-Balance indicator, Moving average (MA), Bollinger bands, Support & Resistance lines, Fibonacci retracement, Stochastic oscillator and many more....
Technical Indicators as I have earlier highlighted, refers to mathematical tools invented by developers to help calculate the data of the previous candlesticks and then produce an accurate prediction of the possible future trend of that asset.
Depending on the developer's idea, every indicator is uniquely designed to operate and predict the future market trend using different technical tools like candlesticks, support and resistance lines, Fibonacci retracements and many more...
They are originally 3 major types of indicators, and they include:
- Moving Averages: This is by far one of the most popular and most used indicator, as it is designed to calculate the current average price of an asset over time. The average price of an asset is calculated within a specified period of time (200 days, 50 days, 30 minutes, 14 minutes etc.)
- Pivots: Pivot Indicators basically deals with informations regarding the support and resistance zones of a given asset, as it helps traders to identify where price tends to bounce off in a chart.
- Oscillators: This indicators are used to detect current momentum trends of an asset and future predictions, by showing how the market acted with similar momentum in the past. It helps traders to make positive decision depending on their views about the value of an asset.
In my opinion, I think technical Indicators works effectively if and only if some important factors are put in place. For the fact that sometimes the Crypto market seems to be really unpredictable, it's clear that a 100% accuracy isn't guaranteed instead analysis are done based on presumption of positive outcomes.
Nevertheless, it's important to note that if a certain technical Indicator has proven to accurately work many more times than it has failed, it's basically considered an effective Indicator for generating profits.
One important factor to consider for effective result
Important factors to put in place for an effective Indicator Includes:
- Two or more highly tested and accurate indicators should be used for confirmation before entering into a trade.
- Most indicators seems to be more effective in shorter time frames, so I would recommend smaller timeframes to be used more often, but with good risk management strategy.
My favorite Indicator is the Simple Moving Average (SMA) and like I said earlier, this indicator calculates the average price of an asset within a specified period of time. Why I love this indicator is because it can be used to produce many accurate trading strategies. In some cases, 2 different SMA can be used in the same chart to predict future trend direction.
One of my favourite strategy with the SMA indicator is the Death Cross (DC) & Golden Cross (GC). Potential entry and exit points can be detected with this strategy.
How Does The Death Cross And Golden Cross Strategy Work Using SMA
This strategy is made up of 2 SMA indicator lines (200 and 50 days MA), and when am using this indicator I set the color of the 50 day MA at green and then the 200 day MA is at Red.
Buy signal is detected whenever the 50 MA(green) crosses over the 200 MA(red) from bottom to the top.
L
.jpg)
As seen in the STEEM/USDT chart above, the 50 day MA(green) crossed over the 200 day MA(red) to the top, which signifies that buyers are taking over the market and a bullish trend is occurring.
Sell signal is detected whenever the 200 MA(red) crosses over the 50 MA(green) from bottom to the top.
.jpg)
As seen in the STEEM/USDT chart above, the 200 day MA(red) crossed over the 50 day MA(green) to the top, which signifies that sellers are taking over the market and a bearish trend is occurring.
Advantages and Disadvantages of Technical Analysis
| Advantages | Disadvantages |
|---|---|
| Technical Analysis helps traders to easily predict the future direction of the market trend with the help of some calculations. | Technical Analysis doesn't guarantee a 100% accuracy on the future trend of a market, instead it gives probability of the market trend |
| Traders can easily place thier buy and sell orders because technical indicators usually provide signals for traders | In most cases, this signals are usually slow and late because some indicators are lagging whereby producing late signals |
| Technical Analysis helps traders to effectively know the support and resistance zones where price usually bounces off. | New traders tends to get confused about the movement of the market trends, and usually need experts to guide them to profits. |
| Technical Analysis can help investors to know the sentiment and conditions of market participants | In most short time-frames, too many trading signals are produced, causing new investors to jump into some wrong trades. |
It's true that the major aim of technical analysis is to help traders forecast future directions of market trends, and to some extent it has delivered successfully on that. Nevertheless, we should put in mind that the crypto market tends to get very unpredictable due to its fluctuating nature.
So in order to avoid loss or regrets, I would advice every trader to implement his/her risk management strategies because one huge loss could wipeout and reduce your entire trading profits to nothing.
Another advice I would give is that we should atleast 2 indicators for confirmation of trends before entering into a trade.
Technical Analysis is no doubt the key to a successful trading, we just need to pick out 2 or 3 Indicators and strategies that works best for us, then carefully use it to detect and predict the crypto market.
I am inviting @offia66, @faran-nabeel and @amryksr to participate in this contest.
Note: All screenshots are taken by me on my tradingview account
This is such an Elaborate explanation to be understood even by a novice like me. I am new to the world of trading but with this, I am insightfully blessed. Thank you for this great piece and success in the contest.
Am really glad that you found this article really understandable, and it's equally important to note that before venturing into crypto trading technical analysis and risk management strategies should be ur best friends. Thanks for your remark and precious time here, I really appreciate ❤️.
Wowww
I must commend your good work boss, I wish I had such knowledge.
Thanks for sharing.
I am glad you found this article really helpful sir, you can easily study and master one or two basic technical indicators and strategies here on the crypto academy, because we have lots of experienced traders and professors who are willing to teach us what we need for a successful Trading experience. I hope to see your entry soonest. Thanks for your precious time here, I really appreciate ❤️.
Honestly, from your write up it's no doubt that obviously you're a trader that really knows how to apply the use of both technical analysis and technical indicatiors very well.
Technical Analysis according to your definition, is actually what traders used it for. Indeed you have written so well. Best of luck to you.
You are correct my friend, I technically analyze an asset before venturing into it, because it will help me to identify the current state and prediction of the crypto market. Thanks for your remark and time here, I really appreciate ❤️.
As I went through the post I was able to agree with almost everything and as you shared your favorite indicator as SMA, it's a very basic indicator to use alone but combining it with other makes it much more powerful just as you do with other SMA to have DC. I prefer to do with RSI when it comes to trading using this.
I really appreciate your post and good luck to you too for the contest.
Yes my friend the SMA indicator is a simple but powerful indicator, as it can be combined to produce accurate results. RSI is equally one of my favorite too and I love trading with it. Thanks for your remark and time here, I really appreciate ❤️.
Yes that's true . In addition to support and resistance, other levels and patterns like trend lines and patterns like head and shoulder and numerous other can be found .
Yes that's problems with majority of indicators .
Good luck
You are very correct my friend, lots of other levels and patterns can equally be formed when the market is technically analyzed, and all this gives traders an edge over the market. Thanks for your remark and precious time here, I really appreciate ❤️
Good evening bro,
This is one advice I love talking about because it's really the core knowledge for any one who wish to work with indicators.
Two indicators would help increase the accuracy of any trader prediction, at same time it's not expected to you numerous indicators because it would just make your chart look unorganized and confusing
Thank you very much for sharing.
wishing you success
You are right my friends, two different indicators makes trading more reliable and accurate. Thanks for your time and remark here, I really appreciate 💖.
Slots https://similar.casino/review/gunsbet-casino