The Steemit Crypto Academy Week 8 | Season 2 | - Homework Post for @stream4u
A pivot point like the name infers is a point of reference; which is determined as the mean average of the market highs , lows and the closing price. So essentially the pivot point or price is the point above which the market is bullish and below which there is a downtrend or a bearish run.
The pivot point gives insights concerning the resistance levels and support levels of the market. It is determined by utilizing the exchange information from past exchanges at certain time stretches ,with intent on attempting to anticipate future pattern or trend reversals .
PIVOT POINT LEVELS
The pivot point levels are partitioned into the support and resistance levels . below we will talk about them specifically .
Support levels
The support levels are normally the points along a downtrend or a point at the beginning phases of an upturn and a point whereby a pattern is suppose to be bullish .This levels are for the most part an oversold region.The market may not generally be as predicted so the support levels have stratas as well.
The support signals are:
S1: This is a point along a bearish pattern where it is normal that the market trend turns around and bullish trend begins .This first support level is when to purchase or go into that specific market. However, things may not go as arranged, and another support level is essential.
S2 : This is the subsequent support level where ,similar to the first , the market is predicted to go on a bullish pattern after a potential downtrend and furthermore even this may not be accomplished and another support level might be required.
S3: This is another support level whereby a pattern inversion to a bullish pattern is foreseen after a potential bearish pattern . This support can be broken and more misfortunes follows.
Resistance levels
This is a point whereby the pattern of a cryptocurrency market is required to go reverse to a downtrend after an uptrend. The resistance levels can likewise be determined and , obviously , it isn't generally right and it could be broken in light of the dubious idea of the cryptocurrency market.
The resistance levels are for the most part an overbought district as more individuals purchase coins , in light of the fact that the are drawn in by the upswing.
Bellow are the resistance levels of the pivot point :
1)R1: This is the principal resistance levels where a market pattern is required to opposite or transform from an uptrend to a downtrend, and if this specific support level is surpassed , more bullish or addition in price proceeds .This is the point whereby an investor sells their positions.
2)R2: This is the subsequent resistance and ,actually like the first, is a point where the market pattern is expected to turn around from bullish to a downtrend, and if this subsequent resistance is broken, more bullish pattern follows.
3)R3: This is the third resistance level whereby a pattern reversal is expected after a long uptrend . This level, similar to the previous resistance levels is an overbought area.
CALCULATING PIVOT POINTS
The pivot point, P =( H+L +C) ÷3
The primary resistance level ,R1 = P + (P − L)
The principal support level ,S1 = P − (H − P)
The subsequent resistance level ,R2 = P + (H − L)
The subsequent support level ,S2 = P − (H − L)
The third resistance level ,R3 = H + 2(P − L)
The Third support level , S3 = L − 2(H −P)
APPLYING THE PIVOT POINT IN A CHART
I utilized trading view.
- Open the chart of any market on trading view
2)scroll the top of the graph and select "indicators "
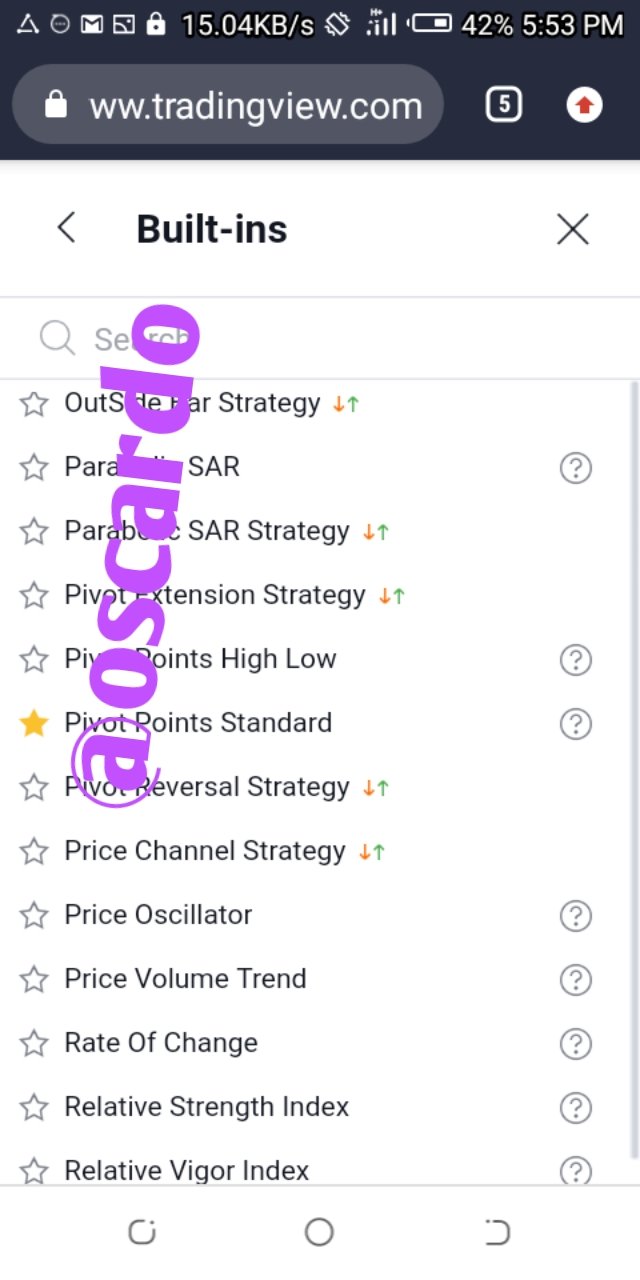
- Click on the "built in" icon
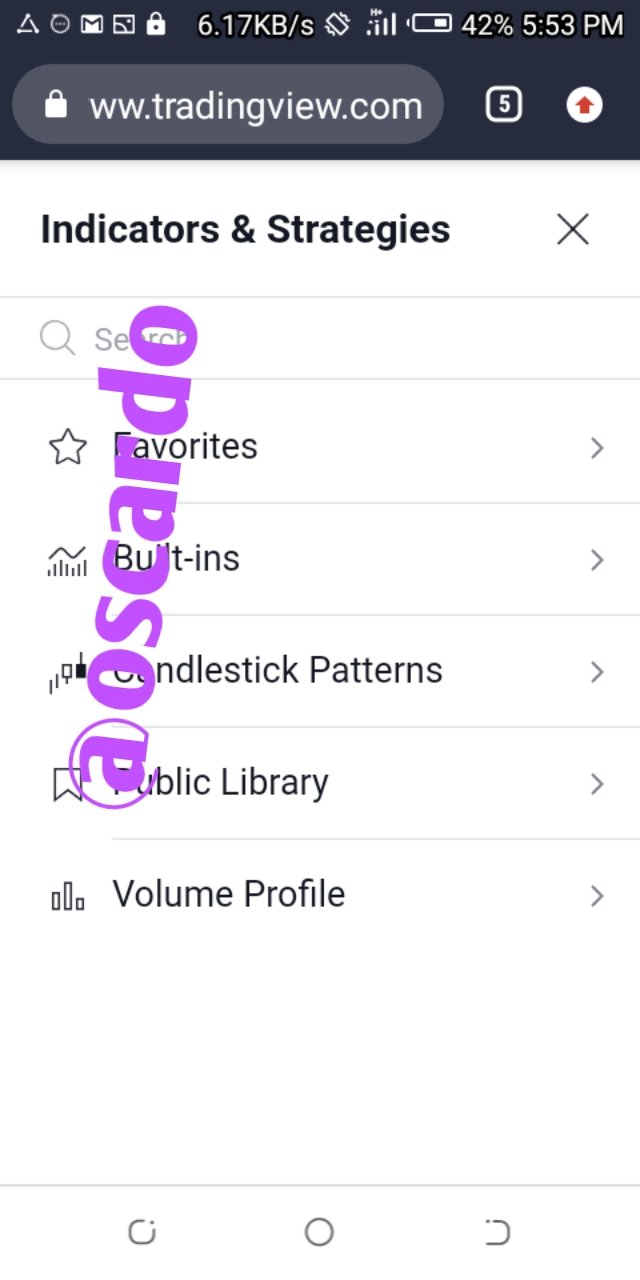
- Select pivot point standard.
HOW PIVOT POINT FUNCTION
Pivot points utilizes the trade history of past trades to tell the current or future resistances or support in a given cryptocurrency market.
This pointer is probably the most seasoned marker utilized and it shows resistance and support signals at various levels, which notifies a dealer when best to go into a specific market ; from the support signals) and when best to leave the market; when the resistance level isn't broken . Very much like we have expressed previously , the pivot point pointer utilizes the high price, low price and the closing price of past trades to predict the resistance and support levels.
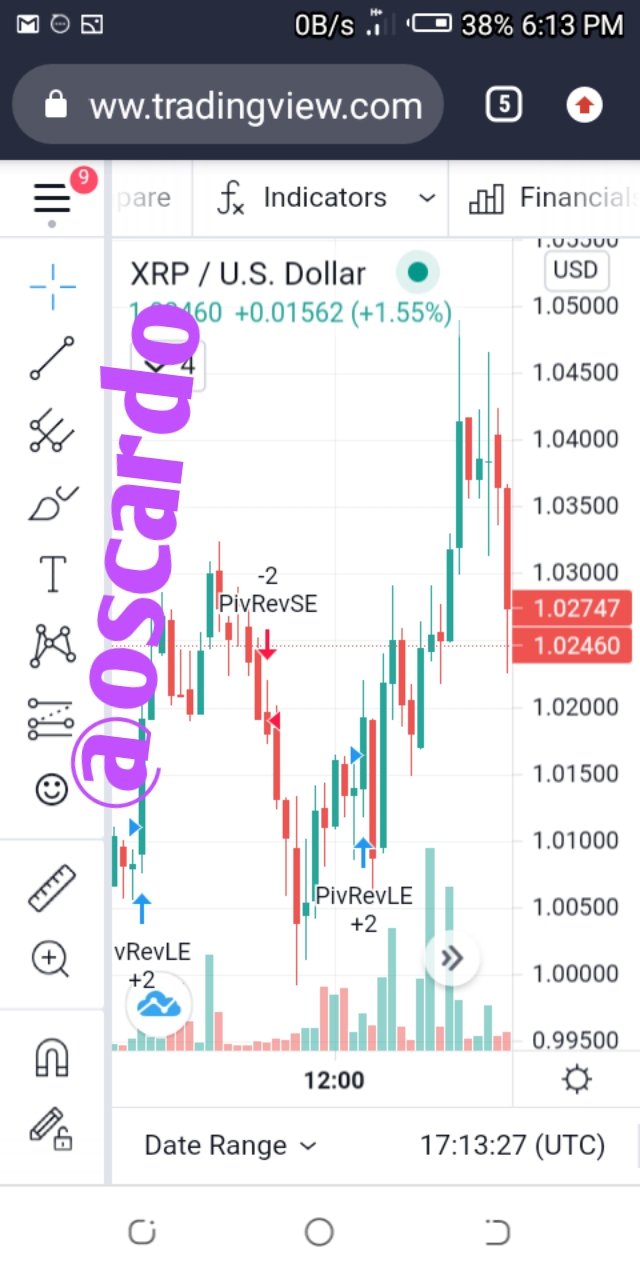
PIVOT REVERSAL TRADING
To make great benefit in the crptocurrency space, one should have the option to decide when to enter and when best to exit and how best to leave that specific market. So pivot reverse trading is the taking of benefits ; that is leaving the market once the resistance signal of the pivot point isn't broken.
This can be done in two ways : leaving when a bearish trend is expected or entering when the support levels are not broken and an uptrend is expected to follow. So , the pivot reverse trading is the utilizing of the different support and resistance signals which are shown by the pivot point indicator , to keep away from losses; for recognizing great entry and exit points.
MISTAKES WHEN USING PIVOT POINTS
When tradingth pivot points , one needs to recollect that in spite of the fact that it is one of the most established marker or trading instrument, it can not be depended upon totally.
Actually like other specialized markers , in light of the fact that it just mentions to us what may happen dependent on history and history may not generally be constant.
Bad information on the interest and supply standard: Many dealers have the thought that since they are utilizing a specialized marker, nothing can turn out badly and the market simply go as anticipated, however that isn't accurate.
In actuality , the lone sure approach to foresee the price of a coin is to run a fundamental analysis; check for the genuine real live adoption of the coin and how the volume of the coin is being reduced or checked.
Ill-advised change of the resistance and support levels: When setting the pivot points , the different support levels ought not be excessively far separated, same thing goes for the Resistance levels . At the point when the signs are excessively far separated, one may not rush to identify the trend inversions , thereby missing chances to make great gains.
REASONS WHY THE PIVOT POINT INDICATOR IS GREAT
The pivot point pointer has various advantages in trading . Bellow are a few .
It is not difficult to Use: The pivot point of a specific market can be determined by basically taking the mean of the past high, low and closing price( (HIGH + LOW+CLOSSING PRICE)/3) , despite the fact that we have platforms that can figure it out digitally, it is still simple to compute manually.
It assists with detecting trend reversals: This indicator is viable ; yet not generally precise , in distinguishing when the market will change direction. On account of its different support and resistance levels , it makes it truly adept at identifying a trend reversal even after the first or second resistance and support levels are broken.
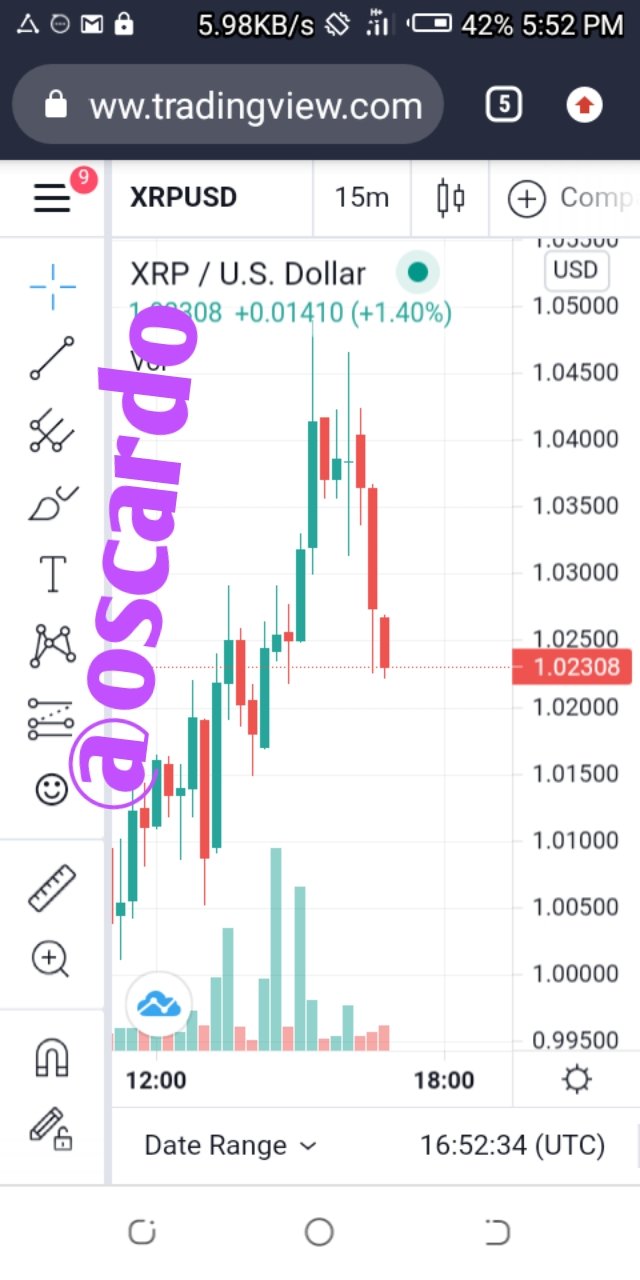
ANALYSIS OF RIPPLE USING THE PIVOT POINT INDICATOR
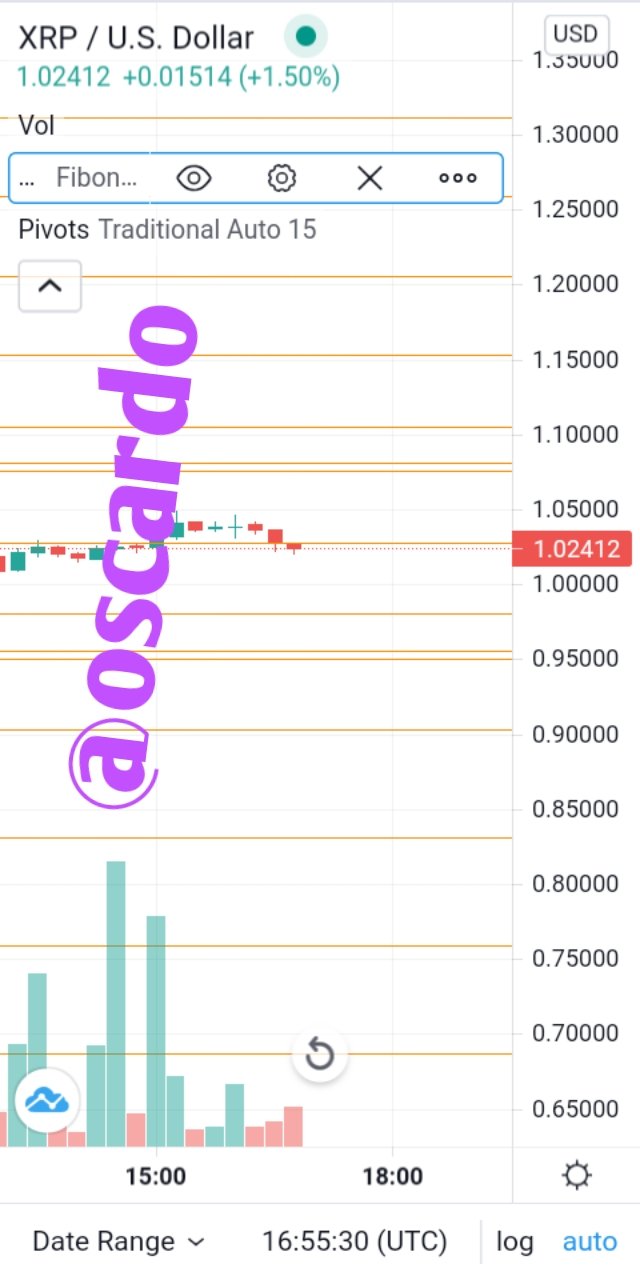
From the chart above, it can be seen that the pivot point for ripple was $1.02412 and the price hovered around that mean point, the trend should be bearish and it may break the first support signal. I predict a trend that wont go bellow the previous low, and a price slightly lower ($1.0200) at the end of today.
RIPPLE(XRP) AND WHY I WANT TO PREDICT IT
XRP is one coin that has crossed the $1 mark, this coin is one that has the potential be a major player in the cryptocurrency space. Ripple which eas created in 2012 it is an open source cryptocurrency that uses the blockchain technology ; although is is not fully decentralized.
TECHNICAL ANALYSIS
This is the use of precious trade data to try to predict the value of a coin. Trade information, like volume , closing price , highs , lows, previous support and resistance signals are analysed and the current or future price of the asset in question is predicted on those past market behavior.
TECHNICAL ANALYSIS OF RIPPLE
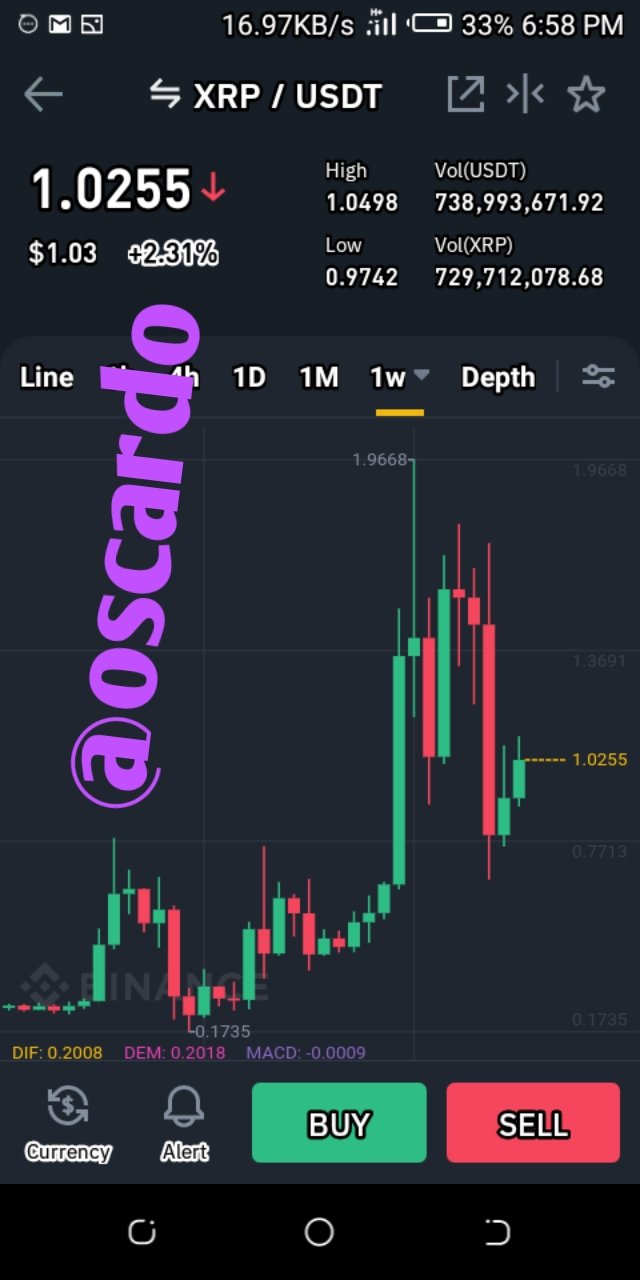
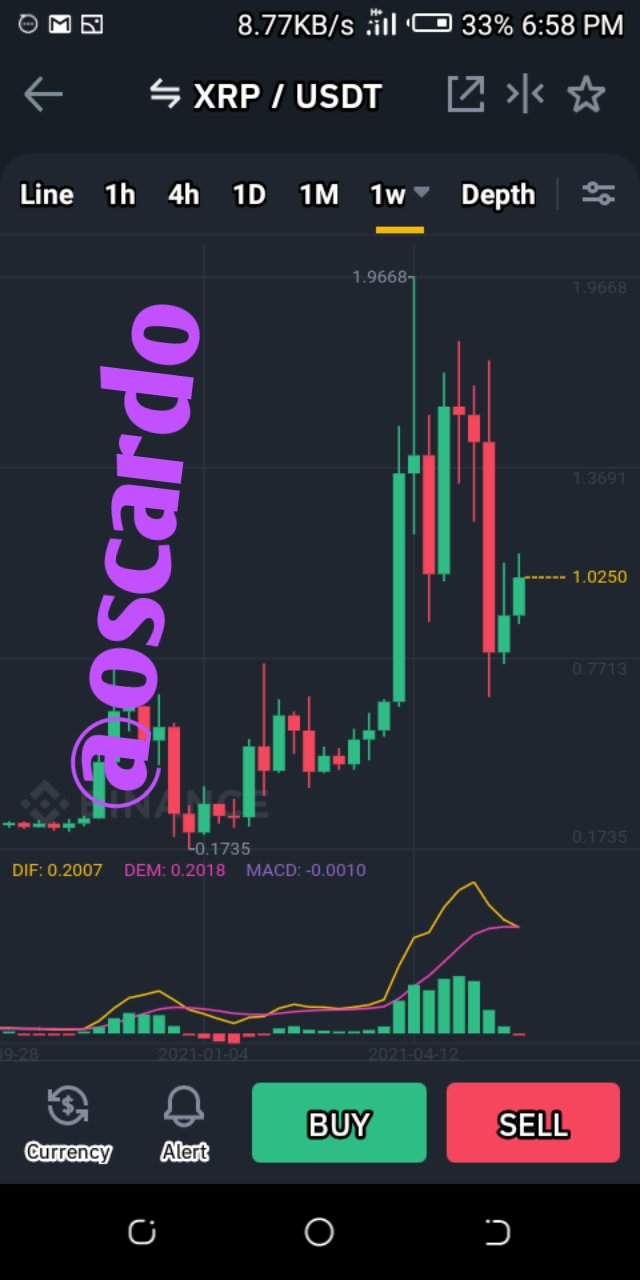
From the XRP/USDT chart above and according to the MACD indicator, it can be seen that the MACD line had converged with the signal line and about to go bellow it.
That means a trend reversal is eminent, and it will play out slowly because it is a weekly chart. So I predict from the chart that because of the previous sharp downward trend , this predicted bearish run won't last and the market will tend to correct itself. So a high price of $1.0200 and a low of about $0.9600 is expected for the next 14 days.
Hi @oscardo
Thank you for joining The Steemit Crypto Academy Courses and participated in the Homework Task.
Your Homework Task verification has been done by @Stream4u, hope you have enjoyed and learned something new.
Thank You.
@stream4u
Crypto Professors : Steemit Crypto Academy
#affable
Can someone still trade using steem. If no, why?