The Steemit Crypto Academy Week 14 | Season 2 | - Homework Post for @kouba01
MACD is called Moving Average Convergence / Divergence,which is developed from the double exponential moving average. The meaning of MACD is basically the same as the dual moving average , that is, the dispersion and aggregation of the fast and slow moving averages characteristics.current
As a tool of stock market investment analysis, technical analysis has two major functions. As a medium and long-term analysis method, the MACD indicator generates cross signals that lag behind short-term trading.
The MACD indicator is a general trend indicator. It is composed of five parts: long-term moving average DEA, short-term moving average DIF, red energy column (long), green energy column (short), and 0 axis ( long-short dividing line ). It uses the crossover of the short-term moving average DIF and the long-term moving average DEA as a signal.
The crossover signal generated by the MACD indicator is relatively slow, and it has a better effect as a corresponding trading strategy.
In my opinion,RSI is better than MACD
In my opinion,RSI is better than MACD because Relative Strength Index (RSI)-one of the most widely used technical trading tools. This indicator is used to help determine when the price of an asset is too far away from its "true" value, allowing traders to profit before the market corrects itself.
With the help of RSI, traders are more likely to get a good trading entry, which makes it a valuable tool for trading in the volatile cryptocurrency market.RSI can help determine when assets cooling, if only a short period of time.Though,MACD is used for EMA but nevertheless they're both good in trading strategy.
Using a MACD indicator to read a chart
Before we taught you how to add a two-line MACD indicator on MT4,
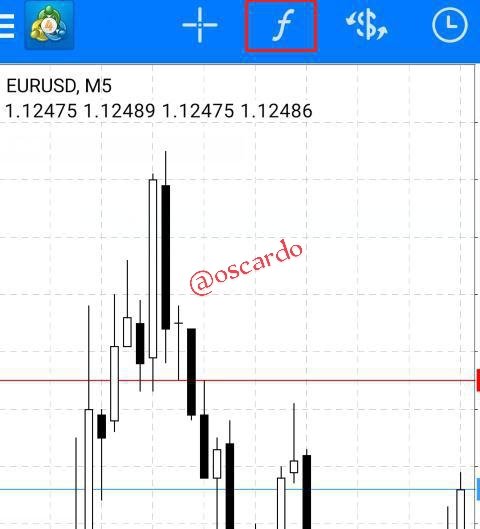
1 Open the mobile MT4 chart, take EURUSD as an example, click "f" at the top of the page to add technical indicators
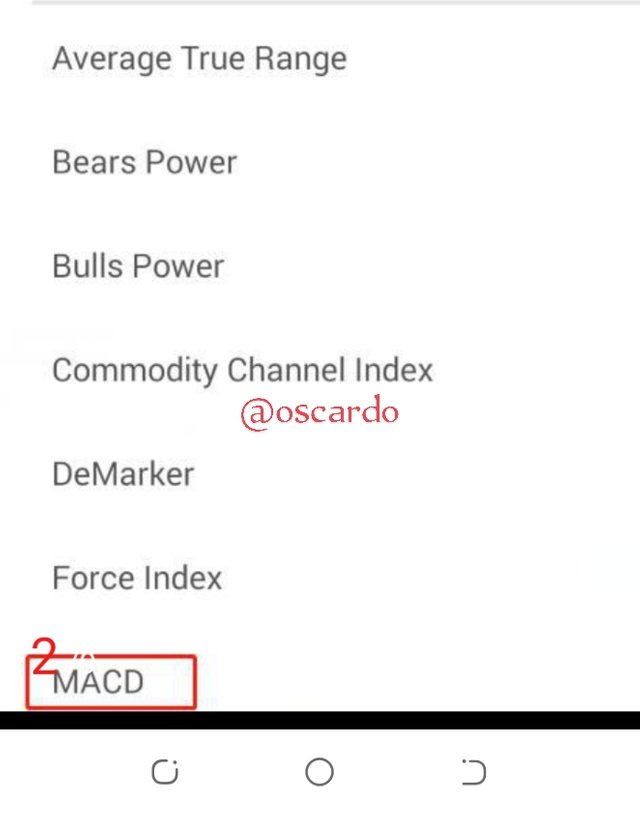
2 Find the MACD indicator in the technical indicators and click Add
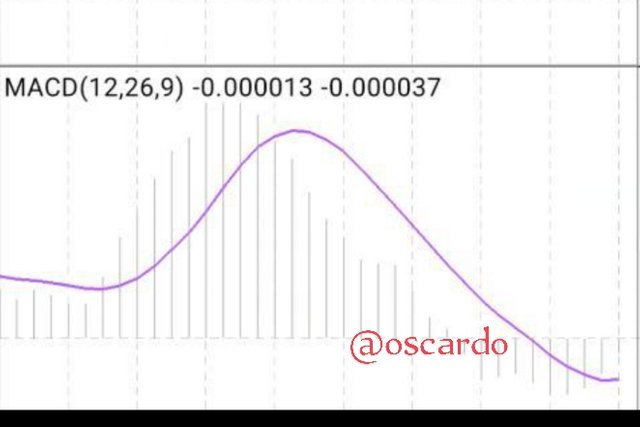
3 Set single-line MACD parameters and styles, 12, 26, 9, and apply to closing,Then we will see the single-line MACD indicator just added in the chart.
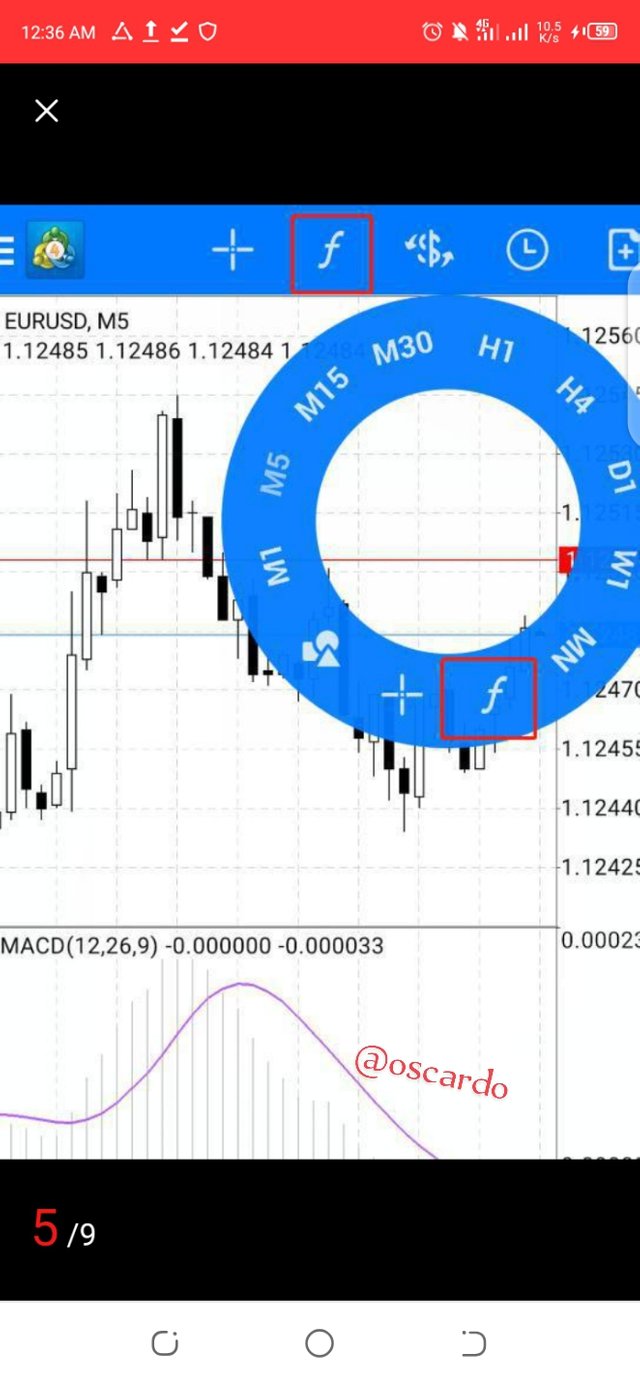
4 Click the "f" at the top of the page again or click the blank area of the chart, the blue circle in the figure below is displayed, click "f"
To change the settings of the MACD, click on the settings logo where the arrow is pointed the modify the style to your taste. You an change the hologram colour, the MACD and signal color as we
Usage of MACD with signal line and MACD crossing line.
MACD is a technical indicator that uses the aggregation and separation between the short-term index average index and the long-term index average index to make judgments on the timing of buying and selling.
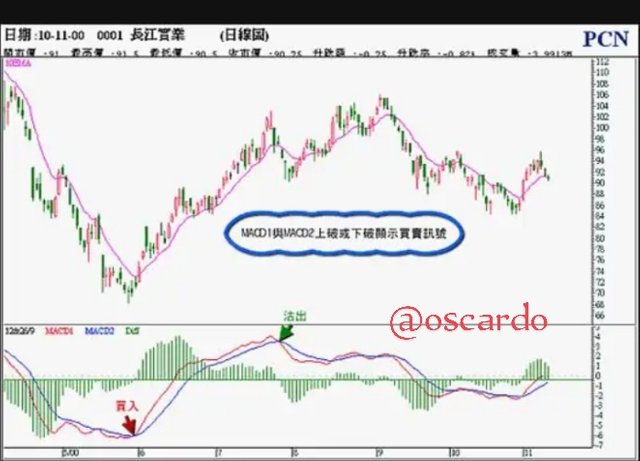
Some of their usage include:
1 MACD Golden Cross : DIFF breaks through DEA from bottom to top, which is a buy signal.
2 MACD dead fork : DIFF breaks through DEA from top to bottom, which is a sell signal.
How to detect a trend using the MACD And how to filter out false signals
MACD is a very useful tool for judging the trend of index or stock price.Some points need to be grasped in the application process.
Theoretical basis The two curves of DIF and DEA in the MACD indicator mainly reflect the trend of stock price movement. A long upward movement of the two-day curve represents a good stock price trend, and vice versa.
The red column represents the long energy, the green column represents the short energy, the lengthening and shortening of the column represents the increase and decrease of energy.
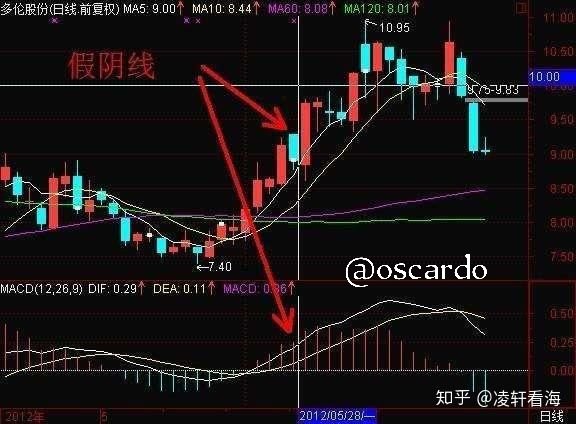
MACD distinguishes between false declines and true rises in stock prices mainly by observing the MACD red and green histograms.
In an uptrend, the stock price has fallen. According to common sense, the MACD histogram will either shorten the red bar or turn from red to green. If the red bar of the MACD histogram continues to grow, pay attention to this. The fall in time is likely to be a fake, and the stock price will continue to rise in the market outlook.
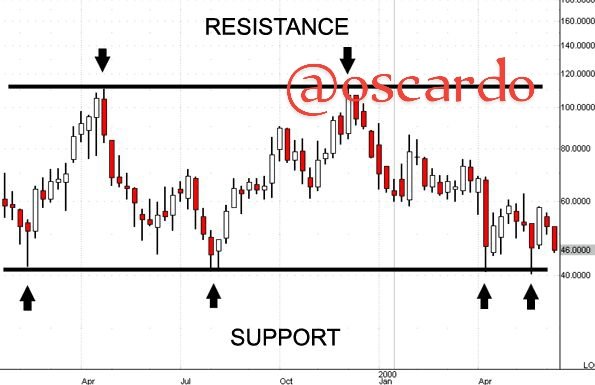
Usage of MACD indicator to extract points or support and resistance levels on the chart.
Pressure (resistance): When the selling order is strong to block the upward trend and the stock price in the market reaches a certain level, it seems to have a resistance line that exerts pressure on the stock price and affects the stock price to continue to rise.
We call it the pressure line Or the pressure level.
Support: When buying orders are strong to block the downtrend, and when the stock price in the market reaches a certain level, it seems that there is a resistance line that supports the stock price and affects the stock price to continue to fall. We call this support Line or support level.
Pressure support indicators are based on observing the operation of securities prices or other factors, collecting relevant data, using relevant parameters, and statistically calculating where prices will encounter pressure and stop rising, and where they will encounter support and stop falling.
This indicator is mainly used to foresee the dense trading areas formed by historical exchanges, and to prejudge the pressure and support levels that may be generated as a result.
Compared with other volume indicators in the form of broken lines, this indicator has the advantages of being graphical, intuitive, easy to observe and analyze and judge, and it is relatively simple to master.
make a review on the chart of any pair and present the various signals from the MACD
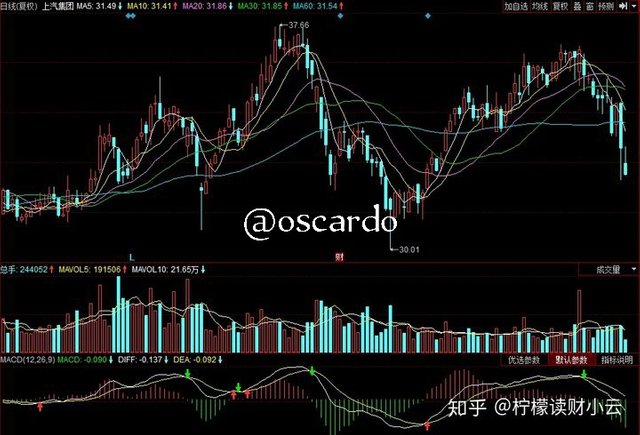
Below the zero axis, bears are strong. If the histogram continues to increase from large to small under the zero axis, it means that the decline has become smaller; when the fast line exceeds the slow line under the zero axis, a golden cross appears, which is a reference for buying signals.
Above the zero axis, the bulls are strong. If the histogram continues to grow from large to small on the zero axis, it means that the increase has become smaller; when the slow line exceeds the fast line on the zero axis, a dead cross occurs, which is a reference for selling signals.
In particular, when we observe the changes in stock prices and MACD indicators, we can clearly see that the MACD histogram and curve reflect the trend of stock prices, but have a certain lag . For example, before the emergence of the golden fork, the stock price has risen; before the emergence of the dead fork, the stock price has increased. Has fallen.
Unfortunately @oscardo, your article contains plagiarized content
Rating 0/10
Source- https://www.liaochihuo.com/info/318134.html
https://www.mql5.com/en/market/product/64714?source=External%3Ahttps%3A%2F%2Fwww.google.com%2F#!tab=comments
The Steemit Crypto Academy community does not allow these practices. On the contrary, our goal is to encourage you to publish writing based on your own experience (or as per the mission requirements). Any spam/plagiarism/spun action reduces PoB's idea of rewarding good content.
Thank you.
Cc: -@endingplagiarism @sapwood
This content appears to be plagiarised as indicated by @kouba01.
If you have not already done so, you should head to the newcomers community and complete the newcomer achievement programme. Not only will you earn money through upvotes, you will learn about content etiquette;
You are currently in Stage 1 of our 4 Stage Process:
👉 Stage 1 - 1st Warning - Pointing offenders towards Achievement 3 and highlighting this process. All plagiarised posts currently pending rewards will be flagged and downvoted to $0 rewards.
Stage 2 - A Final Warning - Another request to stop and that plagiarism will not be tolerated. Downvotes amounting to 20% of total pending rewards according to steemworld.
Stage 3 - A stronger message - Downvotes amounting to 50% of pending rewards.
Stage 4 - The strongest message possible - Downvotes amounting to 100% of pending rewards.
Plagiarists will bypass stage 1 if translated from another language.
Notification to community administrators and moderators:
@steemcurator01 ADMIN
@steemcurator02 MOD