Steemit Crypto Academy | Homework Task 3 For @stream4u | What is Chart Patterns? | Price Breakout - Continuation Patterns - Reversal Patterns | STOPLOSS.
Hello everyone welcome to another home work post by @stream4u who discussed about cryptocurrency charts and what breakouts and support level is so if you want read the post by the Professor click here
Anyway in this post I am going to be explaining a lot of things which are:
1). What Is a Chart Pattern?
2). What Is a Price Breakout?
3). What Is a Continuation Pattern?
4). What Is a Higher High Formation?
5). What Is a Lower Low Formation?
6). What Is a Reversal Pattern?
7). What Is a Double Top Pattern?
8). What Is a Double Bottom Pattern?
9). In Investing & Trading What Is The Importance of Stop Level(STOPLOSS)?
10). Where To Find & How To Set A Stoploss?
11). What Understood From This Course?/ Conclusion.
This would be a very long post but I am up for the challenge and I hope you are ready to learn as well any way let's begin with the first one.
1). What Is A Chart Pattern?
This is the chart pattern that is used to analyze a trade so as to confirm whether it's the right time to buy or sell.
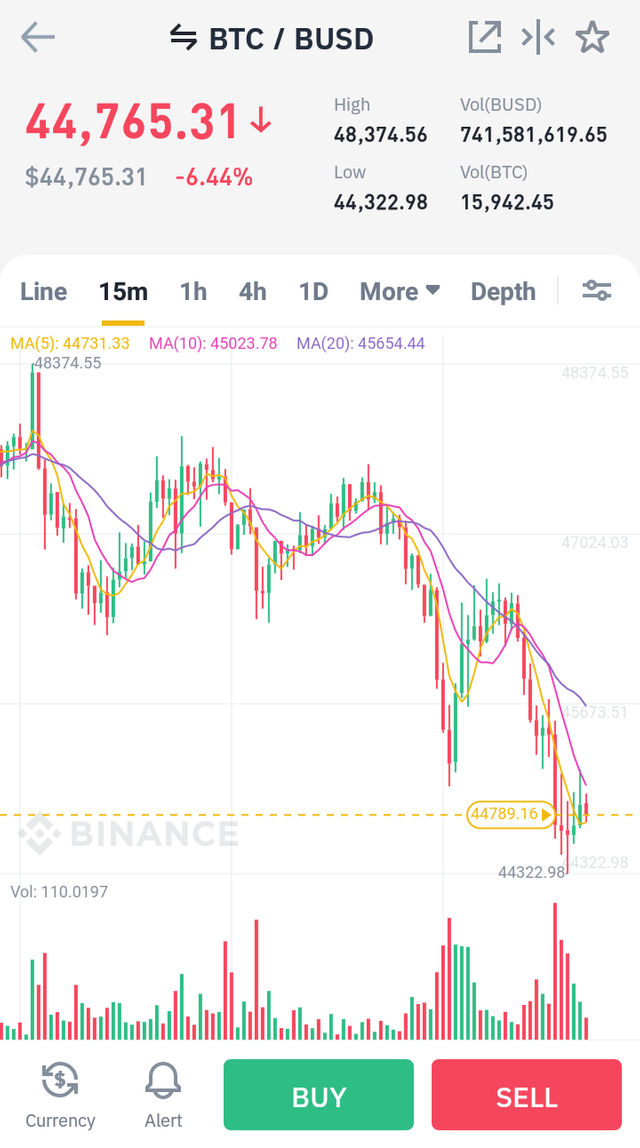
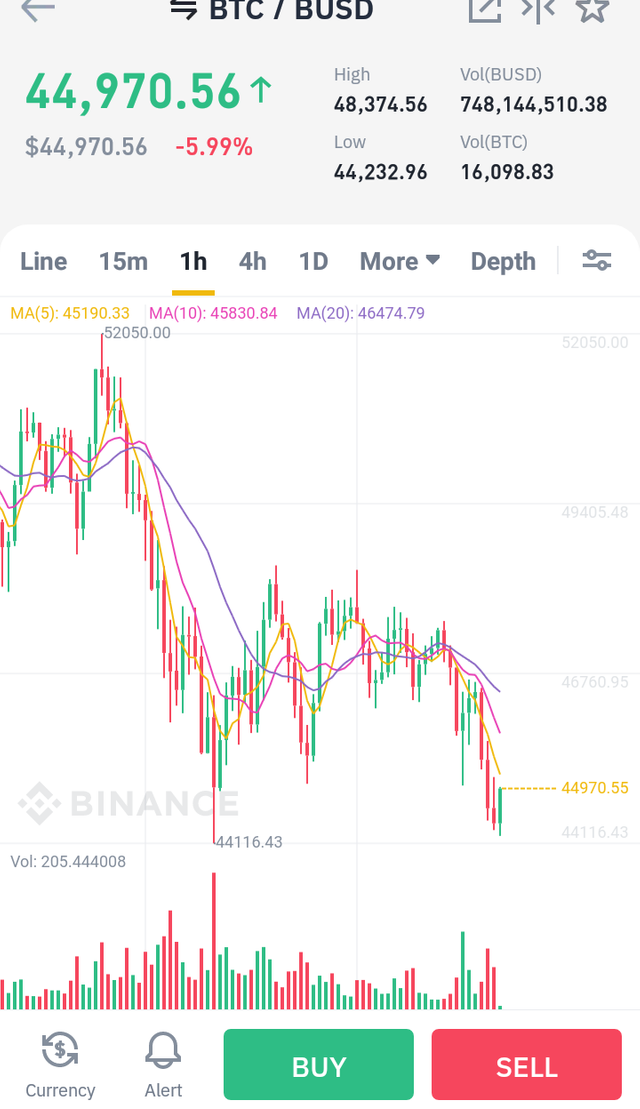
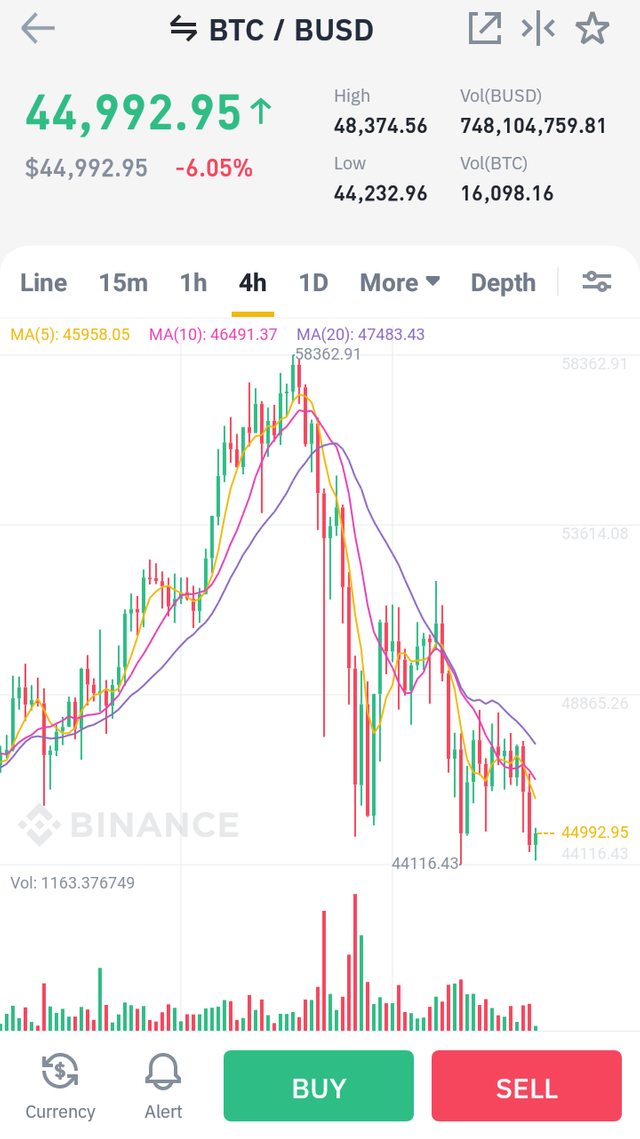
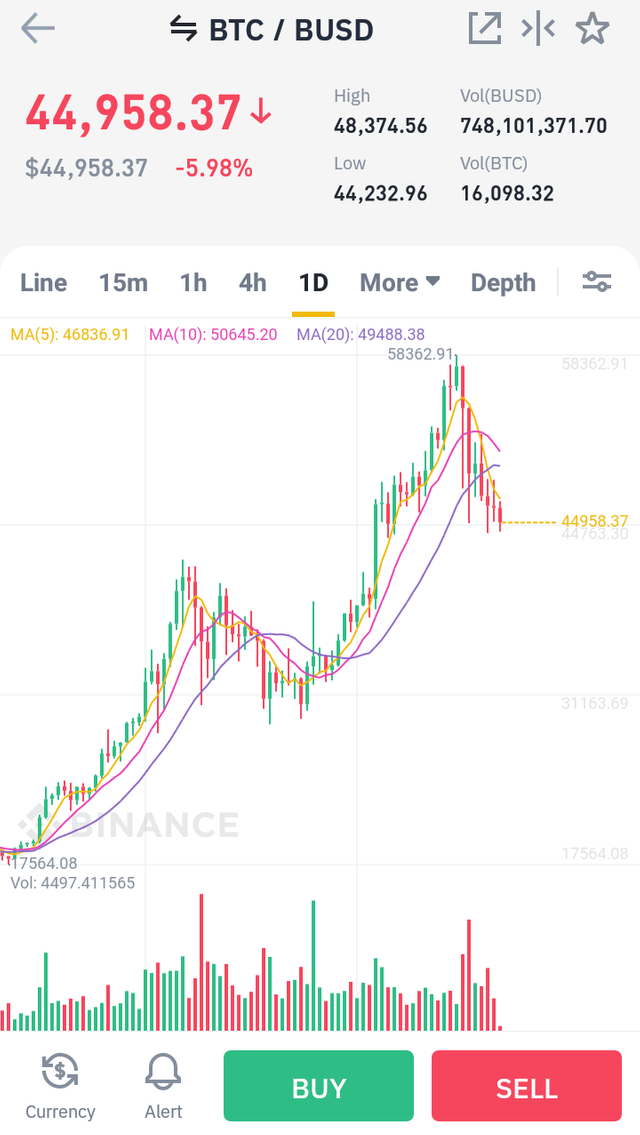
In the charts above you can see the chart above you can use it to determine the next price movement by looking for the support and resistance level.
As we learn that the Support is the level from where assets price looks difficult to move below and Resistance is the level where assets price looks difficult to move above.
If you read the professor post you will see were he explained how resistance level and support any way now you know what a chart pattern is let's discuss breakout level.
Price Breakout
This is when the price of an asset moves above the resistance level or below the support level, when it breaks above it's resistance level then it is looking for a new all time high but when it breaks below it's support level then it is crashing or taking a massive dip.
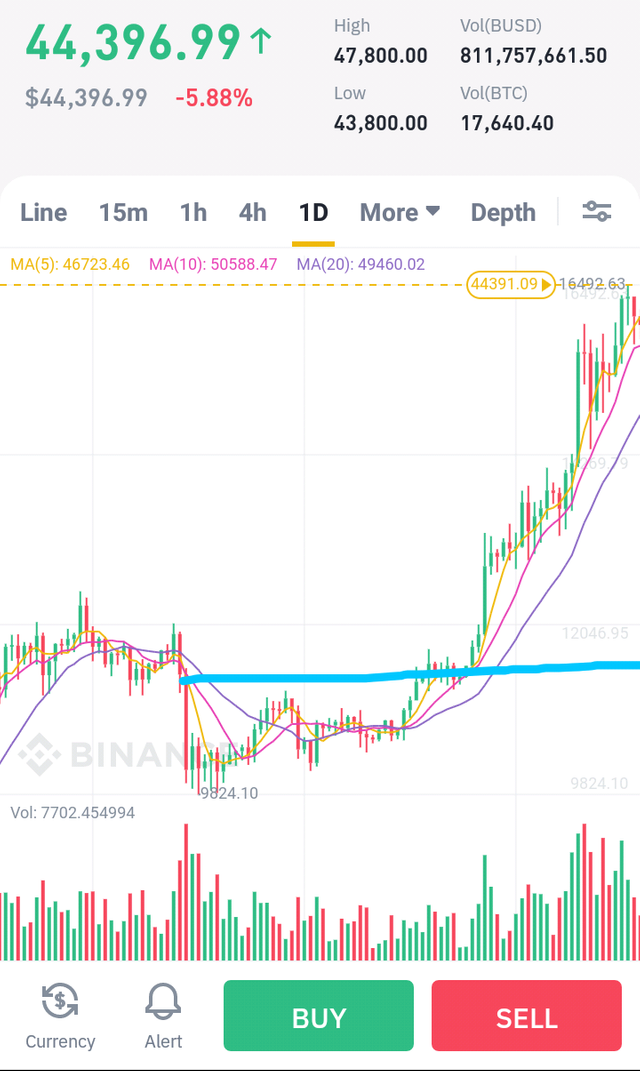
Example of Resistance Breakout
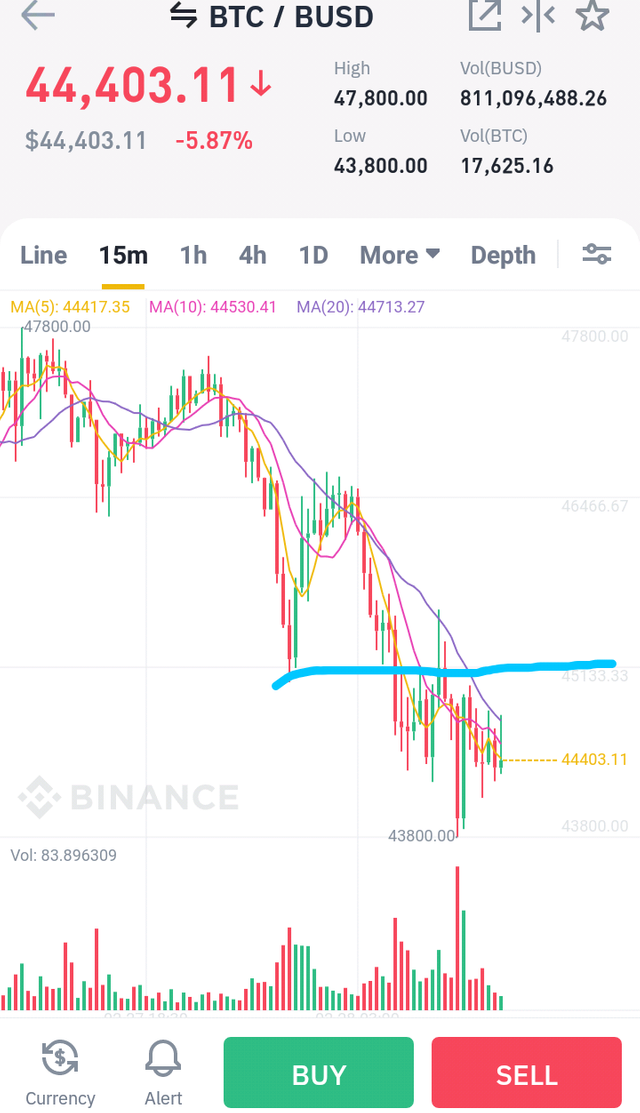
Example of support breakout
What is a Continuation Pattern?
In the continuation pattern it shows that the market will continue in it's trend either in uptrend or downtrend continuation.
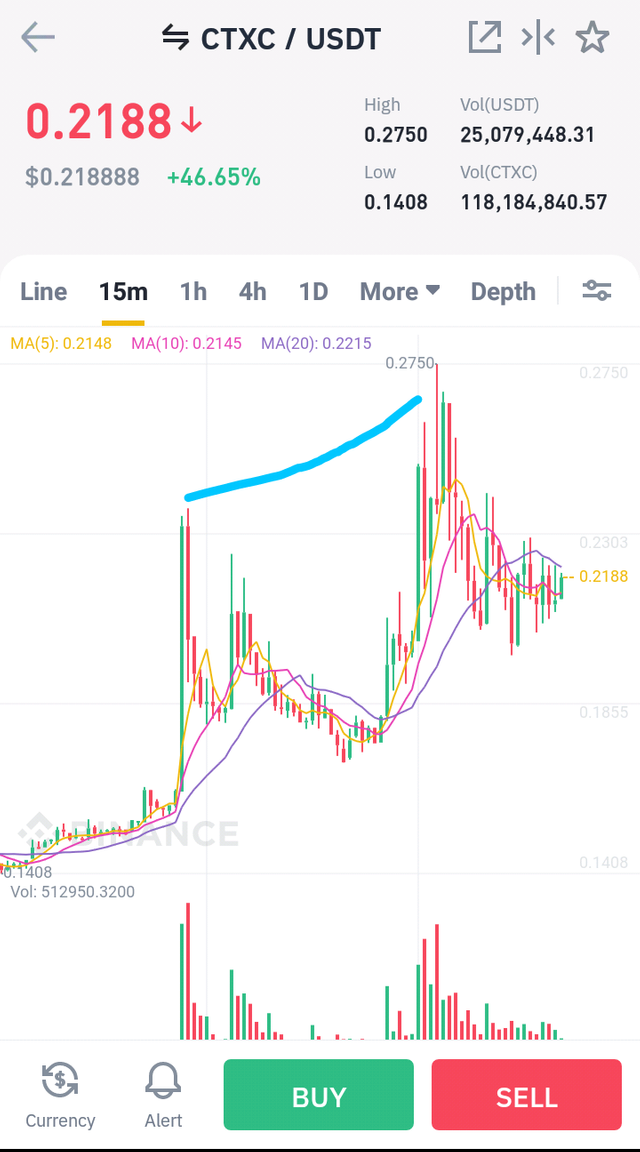
To identify the Continuation patterns on the Technical chart, Higher High and Lower Low is one of the patterns and can be seen on the technical chart in any time frame.
Higher High Pattern
In this, the buyers take command on the asset price more than sellers and take the price back to the recent high.
Lower Low Pattern
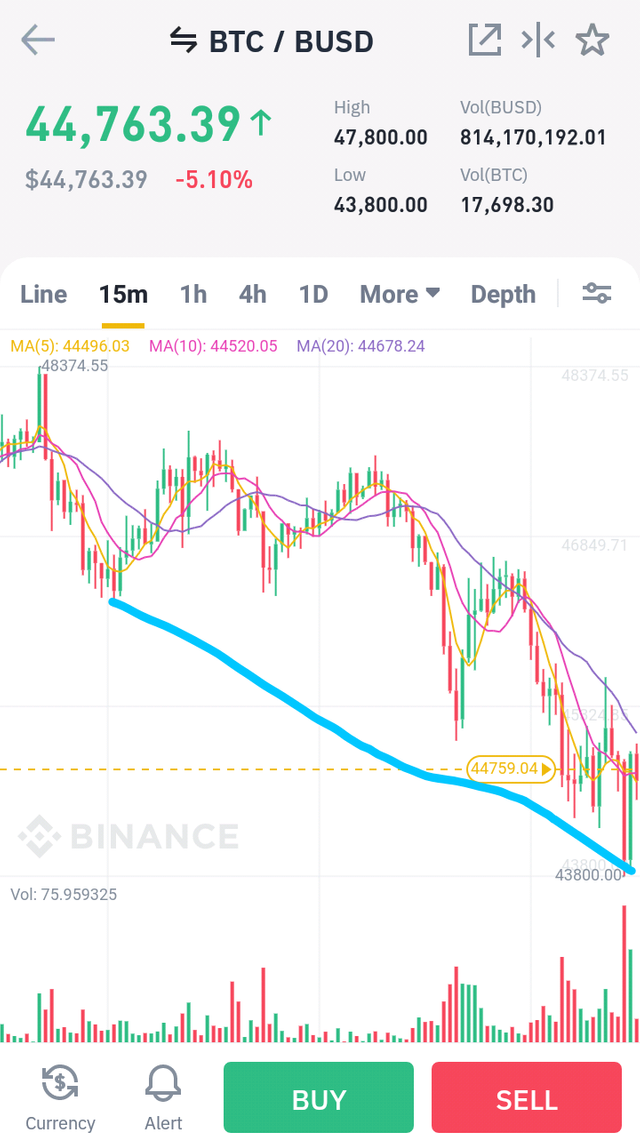
Lower Low Pattern
In this, the sellers take command on the asset price more than buyers and take the price back to the recent low.
What is a Reversal Pattern
This is the pattern that shows the existing trend has come to an end which means the trend will go in reversal direction.
Reversal Patterns can identify on the charts by Candlestick formation, one of the most usable formations which we called as Double Top and Double Bottom
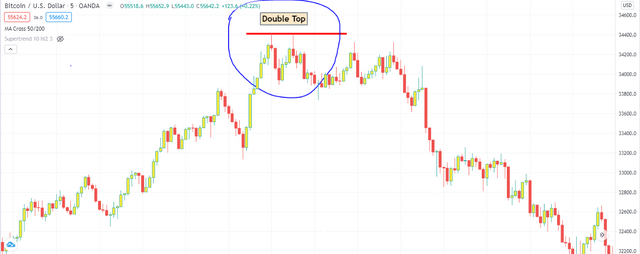
Double Top
In a crypto chart top means a new high but when it does double top this means it hit two high points but at the same level.
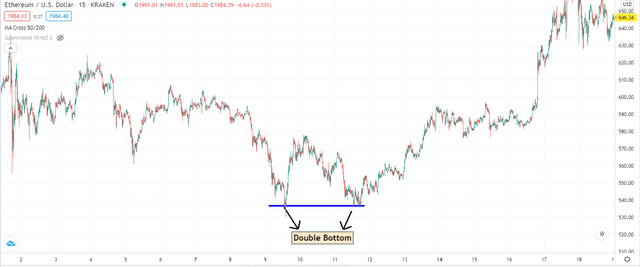
Double Bottom
This is when a chart pulls back at a particular low and in the same time goes up and come down back to that the same low.
In Investing & Trading What Is The Importance of Stop Level(STOPLOSS)?
It is important to know the stop level so that it don't result to more looses when trading, it is like planing which is important because in trading without planning you can get rekt easily.
Where To Find & How To Set A Stoploss?
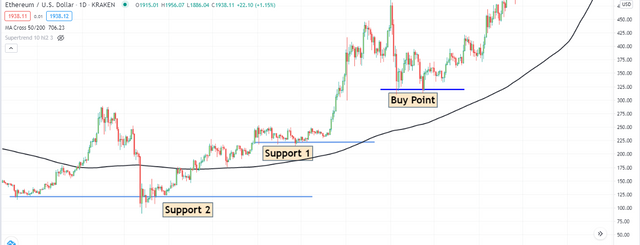
Every asset as an history so to find stoploss you need to look in the chart of that particular asset and find were the last support level.
While Investing or Trading and placing a buy order, we have to check the Assets history and find previous support so that we can limit for our losses.
Ideally, there has to be 3 support and 3 resistance, but at least we have to find 2 supports based on assets history, and according to that we can go for buy order and limit for losses.
Source
Example of how to find and place stoploss
Conclusion
It has been a great learning about every thing that has to do with trading which I know I have learn a lot and I hope you understand everything anyway thanks for reading, i hope i explaned it very well Please @steemitblog and @@@stream4u here is my task entry and thanks for reading
Cc: @steemcurator01
Cc : @steemcurator02
Cc : @steemitblog
Cc : @stream4u
Hi @okoyejoshua
Thank you for joining Steemit Crypto Academy and participated in the Homework Task 3.
Your Homework task 3 verification has been done by @Stream4u.
Thank You.
@stream4u
Crypto Professors : Steemit Crypto Academy