Looking at Support & Resistance | Technical Indicator | Overview Of TradingView | 200 Moving Average.

Homework Task(Topic 1): What Is The Meaning Of Support Can Become Resistance & Resistance Become Support, When and Where set Buy trade, Chart Example?
HOW SUPPORT CAN BECOME RESISTANCE
During technical analysis of crypto trading, we use principle such as support and resistance to analyze the charts in order to set a buy price or sell price target for our trade. Support usually indicates the ideal period to enter a particular trade whiles resistance means you should get out of it. However, the support and resistance isn't always fixed especially within bull or bear markets.
In the bull market, prices of most currencies tend to move in an upward trend. As such, resistance which normally signal a move in a downward direction can flip into an upward trend. In this situation, the resistance has changed into support.
Similarly in the bear market, crypto prices mostly follow a downward trend. Here, a previously identified support that usually signals an upcoming uptrend would flip and continue to trail downwards. Here we say support has become resistance.
WHEN & WHERE TO SET BUY TRADE
During these times, patience is key. There is no need to rush into the execution of a trade. Just patiently wait and draw a line at your newly identified resistance/support. If you entered the trade around the exact time of a resistance flipping to become support, then you can wait it out for a while. Other than that wait for the next few days whiles observing the chart.
Once the price falls around the zone of your indicated line (New Support), do not wait for the old support again. It is ideal to enter the trade now since the first resistance will now act as support and push the price upwards. The old support is now identified as your first stop loss for this particular trade.
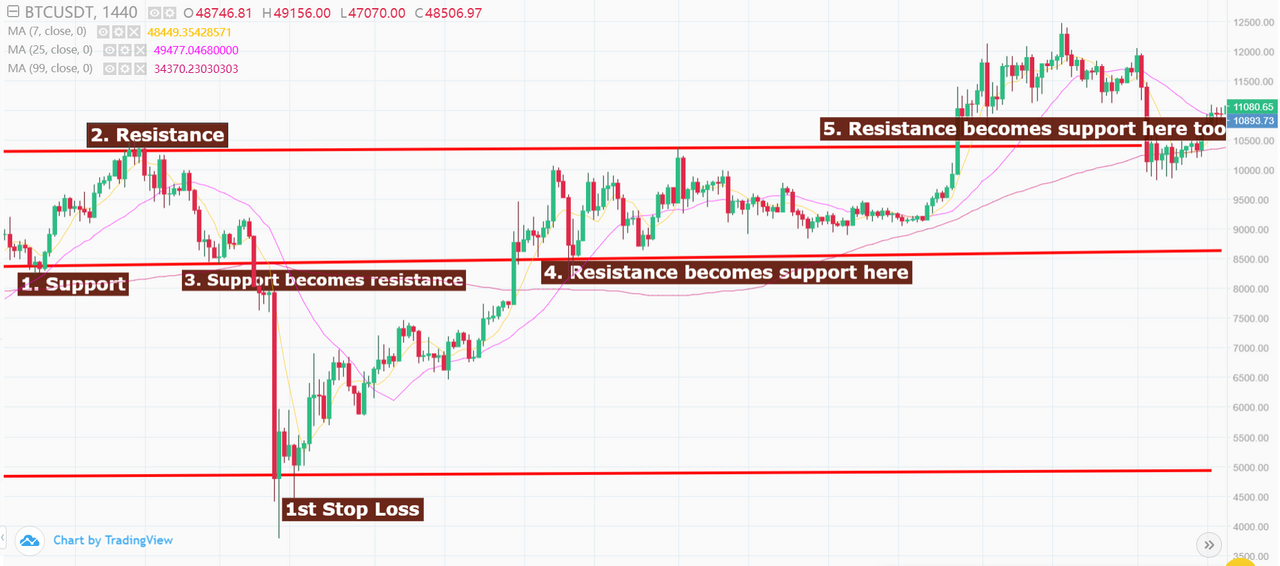
Here you can see the swift changes of how support flips into resistance and vice versa for this Btc/Usdt trading pair
Homework Task(Topic 2): What Is A Technical Indicator? (You can explore it as much as you can, like explain its role, show anyone technical indicator from your chart and name of that Indicator.?)
Technical Indicator
In trading, knowing the exact time to buy or sell is crutial to you either making significant profit or loss. Technical indicators are data that have been gathered over time by expert traders that allow us to pin point these times in real time in order to enter or exit trades at the right time.
As such, they are quite essential and useful and knowing when and which tools to use could really maximize your earning potential. There are over 100+ built in technical indicators which are coded using mathematical functions. Once applied to the trading chart, they start calculating and their numbers according to the price action.
Each indicator has its own way of using and the concept backing it so it is very essential that traders fully understand the ones they choose to apply to their trades.
Note: Applying multiple indicators to your charts does not improve results. It only breeds chaos and confusion.

Access 100+ indicators on the top section of trading view
Homework Task(Topic 3): Provide your view and explore TradingView.
Exploring Trading View
Every cryptocurrency trader seeks to identify better ways of analyzing their charts in order to make better and more efficient trades. Some major exchanges have already adapted to this way of trading by providing a trading view option to better analyze charts. However, for a broader and more technical way of analyzing charts with a wide range of tools, trading view is the suitable option.
Trading view provides a broader experience and provides prices for different exchanges. As such it doesn't really matter which exchange you are using to trade since its market (futures, spot, margin) is available here with a variety of tools to be utilized.

A quick look at the results of a search query
Trading view comes with a variety of plans; Basic, Pro, Pro+ & Premium. Each of these have certain limitations and the higher your plan, the more tools and features you are able to access. However, even with the basic free plan, you can access a wide base of tools not available on regular exchanges.

A available price packages to choose from
Once you visit a particular market or trading pair on trading view, you are able to enjoy a wide variety of tools and products. Even whiles here, you can set multiple alerts to be given when prices reaches a certain level. Another thing that stands out here is the extra options you can get on the chart by just right clicking on it.
I therefore highly recommend this platform for all traders.
Homework Task(Topic 4): What is 200 Moving Average, how and when we can trade/invest with the help of 200 Moving Average? Show different price reactions towards 200 Moving Average
200 Moving Average
This is a long term investment technique used by traders to identify a potentially good asset investment vehicle for good returns. It is a measure of the average closing price of over 200 days using a simple line.
Once the 200 moving average line is drawn, it is observed closely. If the assets price is descending towards the 200 moving average, the price may either go up again or cross it.

A look at this chart shows a bounce back after LTC/USDT was approaching the 200 moving average
Similarly, if the price is ascending towards the 200 moving average from the bottom, it will either fall or move above it. This can also be seen in the example below.

In this LTC/USDT trading pair, you can notice that the prices keep trying to reach the 200 moving average but tends to descend whiles on the way up
For a long term strong buy of an asset, we must identify the one which is holding well above the 200 moving average and stays there such as the one below.

We can see here that ETH/USDT is holding well above the 200 moving average which could indicate a good long term buy
Thank you for your attention.
I would appreciate your thoughtful contributions in the comment section as well. Thank you for your atttention.

Many thanks to the steemit team ( @steemcurator01 & @steemcurator02) for this initiative.
To the attention of professor @stream4u
Hi @njaywan
Thank you for joining Steemit Crypto Academy and participated in the Homework Task 4.
Your Homework task 4 verification has been done by @Stream4u.
Thank You.
@stream4u
Crypto Professors : Steemit Crypto Academy
Thanks a lot for your valuable feedback prof.
Twitter Share : https://twitter.com/bananmuni/status/1368320375990419456?s=19