All About SuperTrend Indicator | Homework
INTRODUCTION
Before entering any trade on the market, you must first understand the reading of the chart as well as various techniques required in the technical analysis of a particular chart pattern. This would guide you in the successful execution of trades and maximize your earning potential as well. That is why it is extremely vital for you to understand how to understand useful techniques such as support and resistance, double top and double bottom, resistance becoming support and vice versa, etc.
Although the above techniques are quite good and very useful, some times we may miss the entry target price we have set for a particular trading pair. Already, the asset in question might already be rising. When this happens, traders commonly wait for their target prices to resurface for them to enter to avoid the pertinent risk.
However, patience is the name of the game. There is another technique that can be utilized in such a situation which I will be tackling in this particular article. It is the supertrend indiator.
What Is A SuperTrend Indicator?
As indicators use historical data collected by expert traders to apply to various trading charts, this works in a similar mana. The supertrend indicator is an easy to use indicator with a very good success rate.
It is used for both short term (including day trades) and long term trades. For short term trades such as day trades, we simply have to modify the chart time to 5 or 15 minutes and for a long term trade, we change the chart time to 1 day so that each candlestick represents the corresponding time.
SuperTrend follows the chart overlay taking into account the current price and volatility of the market. It can be applied to various charts such as that of trading view. Once applied, it can either be seen on top of the current price or below it.
Generally, when it is seen on top of the current price it is an indication to place a sell order and when it is seen below the current price it means buy.
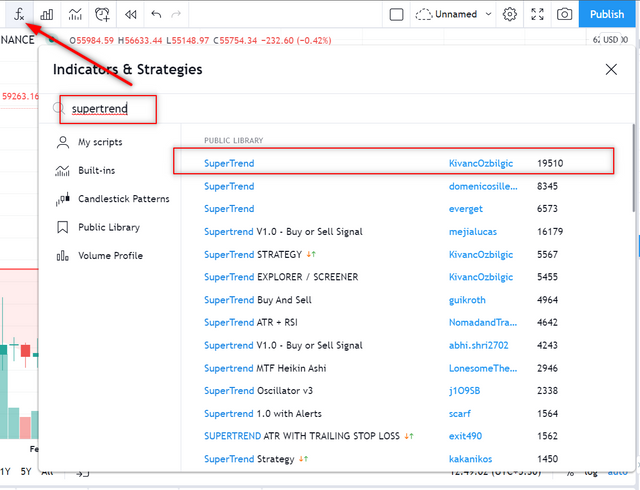
Here is where to find a SuperTrend indicator on tradingview
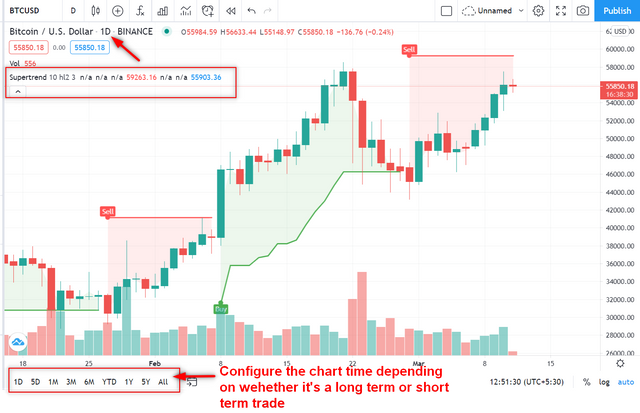
Using SuperTrend on this long term BTC/USD chart
Now let's look further into the use of this great indicator.
How Does SuperTrend Shows Buy-Sell Indications?
SuperTrend indicator works by showing a clear support/resistance barrier on a particular chart just similar to the 200 moving average we last learnt. Here the general concept is to enter the trade when this indicator is beneath the current price and to exit the trade when it is above the current price.
But it is not as simple as that as there are other things you must consider as well.
FOR A BUY ORDER
To place a buy order with the SuperTrend indicator, you need to first make sure that the indicator is beneath the current price. This is because that is an indication of a strong support forming at the bottom. That's not all since you have to wait for the upward trend to correct itself. Once it starts falling back to the strong support, be ready to place an order as soon as the price approaches this support.
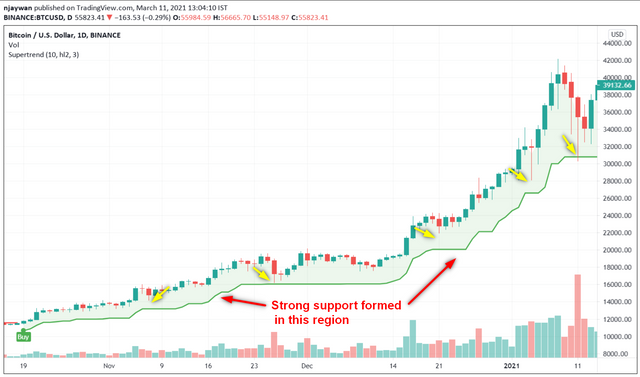
SuperTrend indicator showing the formation of a strong support on this BTC/USD pair
FOR A BUY ORDER
Similarly, for a buy order with this indicator, you must make sure the current price falls beneath the indicator. You would notice the formation of a strong resistance at the top of the current price level. Once identified, you need to exercise patience for the price to approach the indicator line. An entry can then be made as the price nears the strong support demarcated by this indicator as seen below.
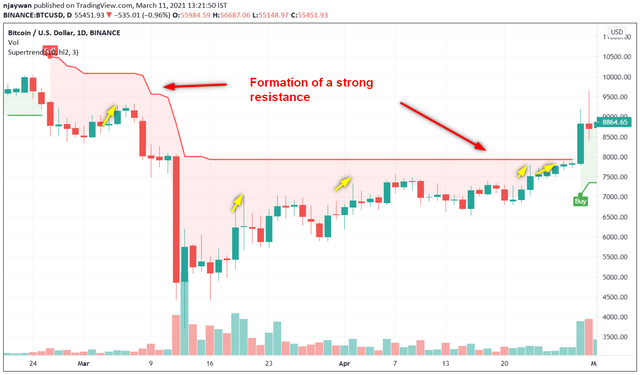
SuperTrend indicator showing the formation of a strong resistance on this BTC/USD chart
When We can Place a Buy Trade with the help of SuperTrend Indicator?
To understand the full use of this indicator, you must first of all study the chart and observe it for a while. This is because, there are times when there might be a heavy dip or a sharp contrast between a previous price and a current one. This creates some ambiguity within the trader's mind making him second any decision or position he is about to take.
This is why SuperTrend indicator is quite helpful in these situations as it shows a clear-cut support or resistance line within the chart to remove this doubt. This is quite evident once you take a look at these two screen shots.
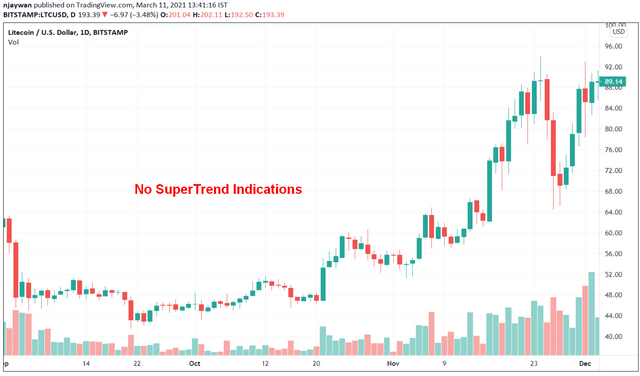
No clear sell/buy entry indication on this LTC/USD chart
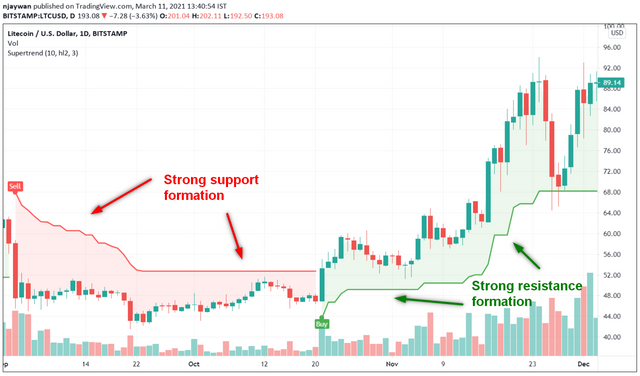
Clear resistance/support indications with SuperTrend making buying and selling decisions easier on the same LTC/USD chart
In the chart below you can observe a running market an a clear-cut support line placed by SuperTrend. It is always advisable to enter a buy trade when the support is quite clear since this is an indication of a strong support. You can see that in the LTC/USD chart below, the market runs from around $50 to $65 after which there is a strong support formation. It is ideal to place a buy order here as the build up occurs since there is a high potential of a spike which can send it up as seen here (to $109+)
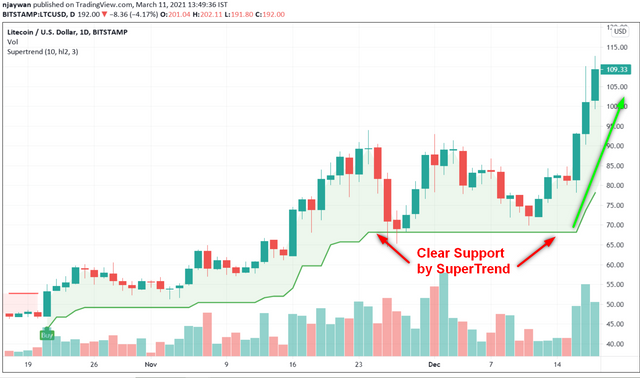
Showing support build up indicating that it is ideal to place a buy order on this LTC/USD chart
When we can place exit/square off, sell order with the help of SuperTrend Indicator?
To place an exit/sell order with the SuperTrend indicator, a clear-cut resistance must be seen on the chart. So in a running market where a resistance is almost occurring doesn't give us the confidence we need at this particular point. The resistance here must be quite conspicuous. This tells the trader that the price is about to take a turn downwards as such an exit strategy is ideal in this situation.
Let's take a look at the chart below. We can see clear indications to take an exit out of the trade. If you missed the first one, be sure to leave the second one before it gets too late.
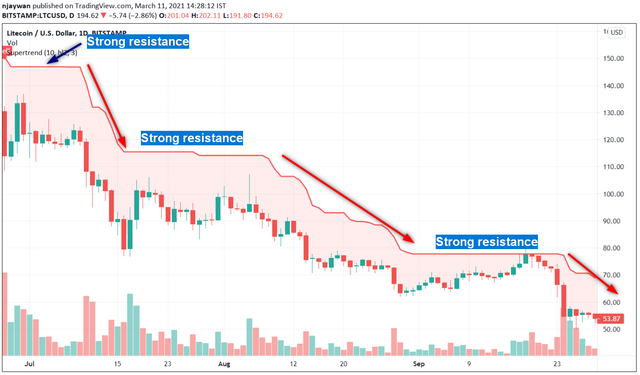
SuperTrend showing indications of a sell order/exit on this LTC/USD chart
How false indications look in SuperTrend Indicator?
Despite the fact that SuperTrend indicator is very helpful and provides useful signals in the successful execution of trades, it isn't always a 100% accurate as it can give false signals leading to wrong trades.
This is why you must be patient before delving into any trade here. This is quite evident in the
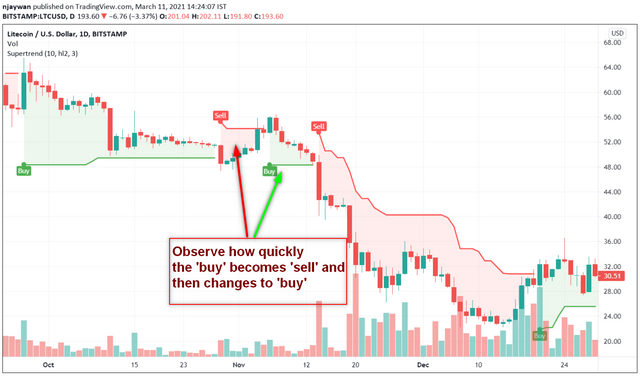
SuperTrend indicating a false signal on this LTC/USD chart
The StopLoss I would Suggest
Since trades do not always go our way despite all the efforts and strategies we put in place to ensure this, it is vital to exercise precaution. This is when StopLosses come in. StopLosses are marked to prevent significant loss of assets during the execution of a trade. Knowing what StopLoss to set is also vital because trading can be deceiving which can cause you to exit a trade which was simple correcting itself and returning in an upward direction.
To demarcate a point or region of stoploss, we must first identify the last two lows. This gives us ample time to see if a downtrend is really a sign of a bear rally or it is just another correction in the market which means it is bound to bounce back.
In the LTC/USD chart below, we can see the 2 lows forming just above $60. Here we can set our stop loss here before delving into this particular trade.
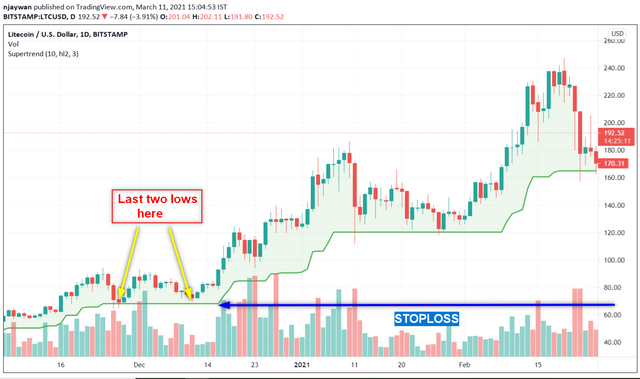
Identified StopLoss in this LTC/USD chart
Conclusion
SuperTrend is an efficient and easy to use indicator which guides both experienced and new traders during trades to make good trades so as to maximized their returns. Although not a 100% effective, it is mostly accurate as it shows a clear-cut support and resistance in its sharp movement indicating an ideal time to either buy or sell.
With time and experience, false indications are easily identified as well and traders can wait for the appropriate time to enter the trade. Stop losses are also readily identified and demarcated so that we don't incur significant losses. In all, it is a very efficient indicator I would highly recommend to all.
Thank you for your attention.
I would appreciate your thoughtful contributions in the comment section as well. Thank you for your atttention.
Many thanks to the steemit team (@steemcurator01 & @steemcurator02) for this initiative.
To the attention of professor @stream4u


Hi @njaywan
Thank you for joining Steemit Crypto Academy and participated in the Homework Task 5.
Your Homework task 5 verification has been done by @Stream4u.
Thank You.
@stream4u
Crypto Professors : Steemit Crypto Academy
Thank you very much prof.
Twitter Share: https://twitter.com/bananmuni/status/1369951604410114050?s=19