Crypto Academy / S4W6 - Homework Post for @kouba01 by @ngoenyi

Hello my good friends. Hope we are doing great. A nice day to you all. This is another week of crypto academy. I will be writing on the homework task of @kouba01 what taught us on the topic Crypto Trading With Chaikin Money Flow Indicator

kindly explain In your own words, what CMF indicator is with an example of how to calculate its value?
What is CMF indicator
The Chaikin Money Flow(CMF) is a type of volume indicator developed by Marc Chaikin in the 1980s. It is used to track the accumulation and distribution of an asset over a known period of time.
It measures the buying and selling pressure of an asset within a specific period of time. This market pressure is also referred to as volume of cash flow. It works on the premise that the market strength of an asset is closely followed by increasing volume and the price closing high half of the daily range.
It is normaly shown in a chart as a green and red oscillator around a 0 line, which moves from +100 to -100 or in some apps from +1 to -1 . The green areas are indicative of net buying pressure while the red areas signify net selling pressure.
The oscillator seeks to identify price movements in assets that are supported by price or volume patterns, from those that are not. In determining the sustainability of a price movement, it takes into consideration two major factors
● Does the asset close strong in its upwafd or downward move
● Does the move come with relatively high or low volume
So, if the stock closes high in its daily price range on high volume, it implies a buying pressure. But if it is closes low in daily price range on high volume, it implies a selling pressure.
A stock that have a very strong closing price, have more potential to continue with the uptrend. At the same time, the volume an asset closed with helps us to know what the participants in the market are willing to pay for the assets,
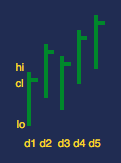
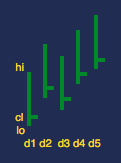
From the picture A and B, we can see that the assets closing price had the same level of movement, but the asset in Picture A, showed that the price closed near to the high of each day, while that of picture B closed near to the low of each day.
So asset A have a potential upward movement compared to that of B. We can also use the same scenario, to explain the volume as well.
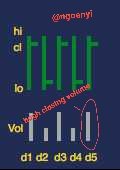
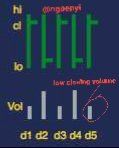
We can also observe from the two picture above that picture A, closed with a higher volume compared to B. Thus asset A have a potential upward movement than B.
In summary, from the above illustration we can deduce that when the closing price is near to the high of the day with an accompanying volume, (CMF) is positive, indicating a period of accumulation (buying pressure). But when the closing price is near to the low of the day with an accompanying high volume, (CMF) is negative, indicating a period of distribution(selling pressure)
How to calculate its value
We have two methods or calculating it.
The first way of calculating it is by using the formula below
(Chaikin Money Flow(CMF)) Value = ((((Close price – Lowest price)–(Highest price– Closing price))/(Highest price–Lowest price)) * Volume)/Total(Volume, 21)
Where period 21 or 20 is being used as the default period for most times.
The second way we can calculate the value of CMF is by
● Calculating the cash flow multiplier
Cash Flow Multiplier = [(Closing price - Lowest price) - (Highest price- Closing price)]/(Highest price - Lowest price)
● Calculate the volume of cash flow
Cash flow volume = cash flow multiplier(CFM) x volume for the period
and finally
● calculate the Chaikin money Flow
Chaikin Money Flow(CMF) = sum of 21/20 periods of cash flow volume/sum of 21/20 periods of volume
That is summing the cash flow volume over a specific period of like 20 or 21 days divided by the volume of 20 or 21 days.
Let us now assume that the
Low = $300
High = $800
Closing = $450
Volume for the period= 3,000,000
21 period sum of volume = 3,500 000
Using the second formula above
Let us calculate the cash flow multiplier
CFM = [(Closing price - Lowest price) - (Highest price- Closing price)] / (Highest price - Lowest price)
      = [(450-300) - (800-450)]/(800-300)

      = [150 - 350]/500

      = -200/500    =  -0.4
Next calculate the volume of cash flow
(CFV) Cash flow volume = cash flow multiplier(CFM) x volume for the period
CFV = - 0.4 × 3,000,000
= -1,200,000
Chaikin Money Flow(CMF) = sum of 21/20 periods of cash flow volume / sum of 21/20 periods of volume
CMF = - 1,200,000/3,500,000
CMF = -0.34
The value of the CMF is negative, which is indicative of a selling pressure. Thus it may be time to enter a sell trade after making other necessary confirmations.
Show how to add the indicator to the chart on a platform other than the tradingview, highlighting how to modify the settings of the period(best setting).(screenshot required)
I am using investing.com to illustrate this
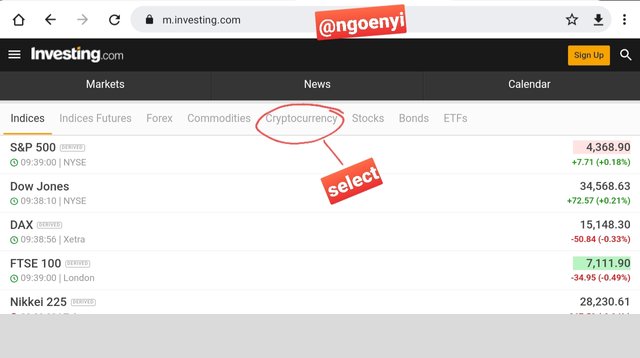
● type investing.com on the browser and the page will come out.
● Select cryptocurrency on the front page
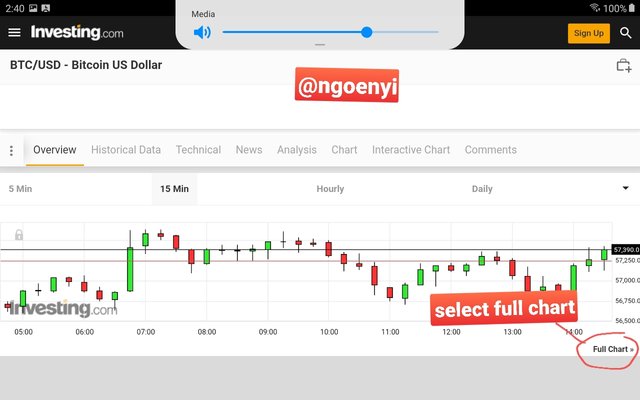
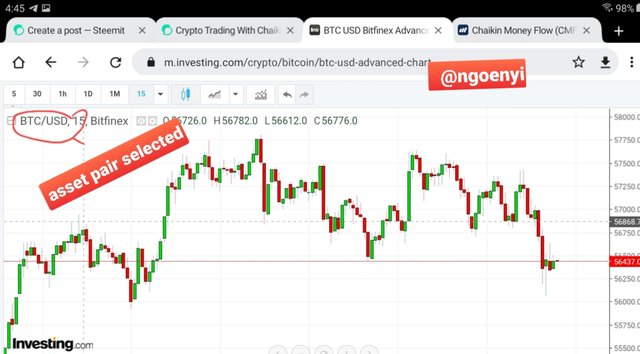
● choose a cryptocurrency pair of your choice
● Select full chart.
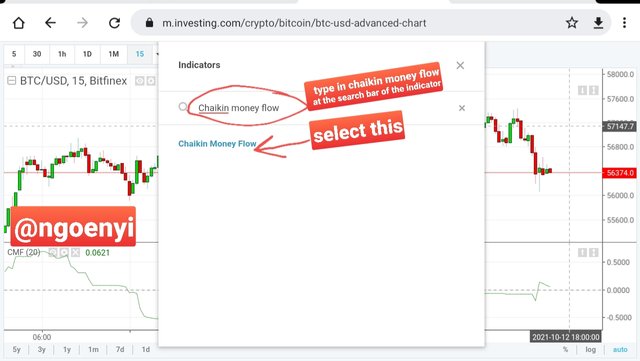
● click on indicator icon to select the needed one.
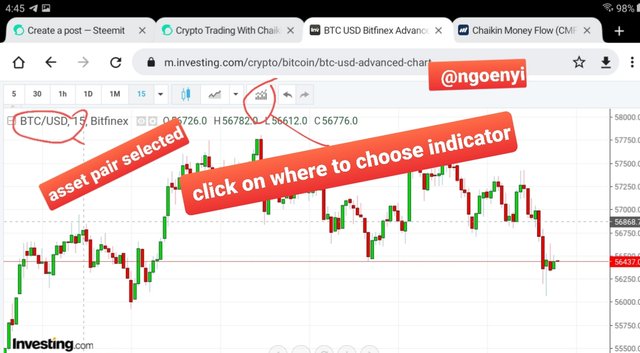
● type chaikin on the indicator search bar, select chaikin money flow
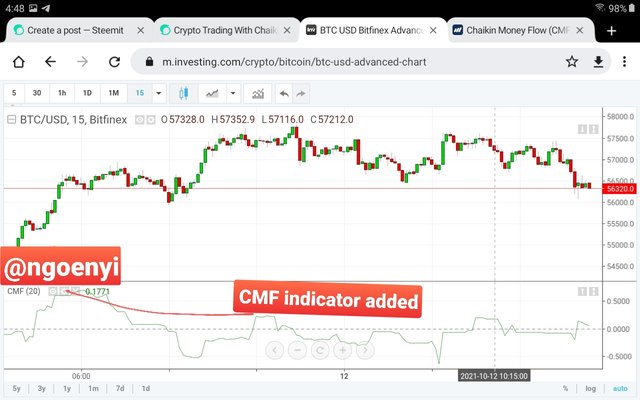
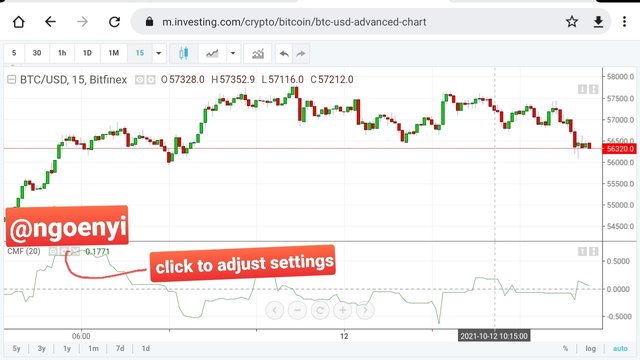
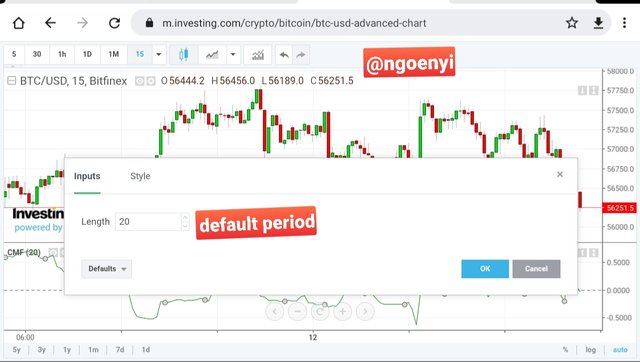
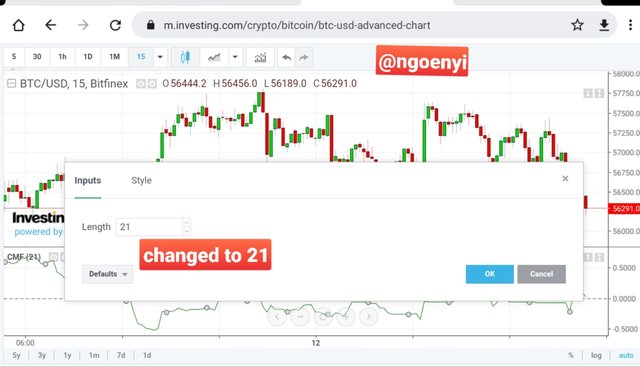
● it will appear on the chart, click on the settings, the period or length already have a default of 20 days, i changed it to 21 days.
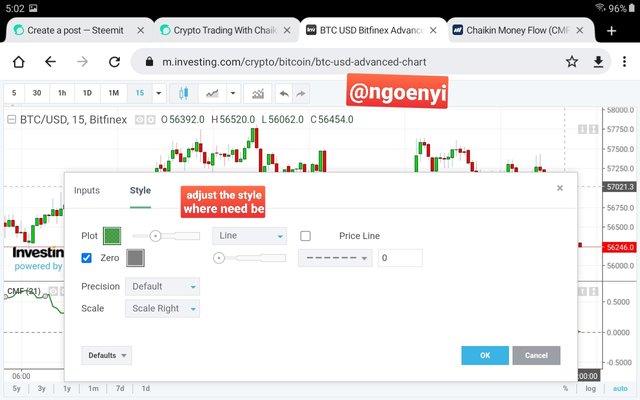
● Click on style and make any adjustment you want on the settings, I just thickened the CMF line.
● Then click ok, to apply on the chart.
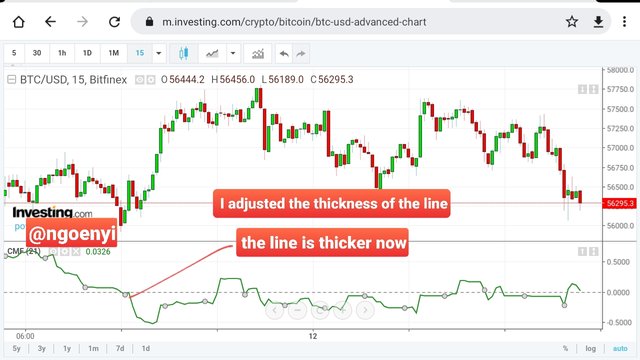
This is how to set the Chaikin money Flow indicator on our chart.
We should note that the default settings of periods in most trading charts are 20 and 21 days. However, the best settings are determined by the trader depending on his trading style and what suits him best.
However, it is always best to work with more than one indicator. This principle is also applicable to the use of the CMF indicator.
What is the indicator’s role in confirming the direction of trend and determining entry and exit points (buy/sell)؟(screenshot required)
Let us remember that the CMF indicator only shows a buying a d selling signal based on money flow volume within a specific period of time as it moves within the ranges of 1 and -1.
Buy Trade
This occurs when the indicator is moving above the 0 range to 0.1 range and constantly moving up in positive values, it indicates a buying pressure. It is a good point to enter a buy trade .
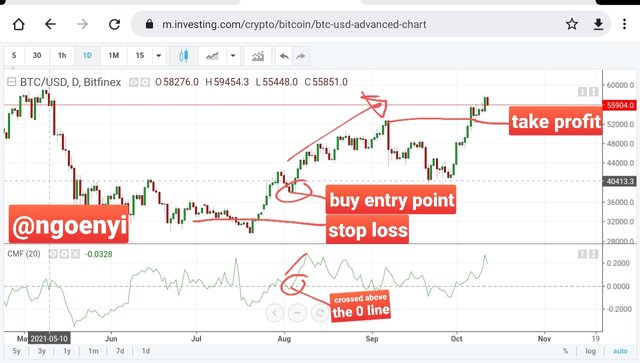
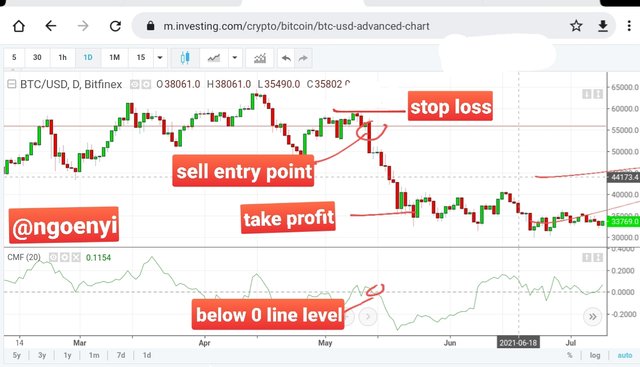
From the chart above, we can observe the marked point when the indicator pointer moved above the 0 line level. At that point, it is good to take a buy entry as well as the begining of a trend. It was followed by a heavy upward trend after crossing that mark. We can also see that at the point of entry, there was a clear break and retest of that breakout for confirmation too.
My take profit is also seen in the chart above. The take profit was the point of divergence on the indicator. Even though the price was moving up, the indicator was pointing downwards, showing weakness of the market. It was the best time to exit the market knowing that a reversal is imminent.
My stop loss was placed at the next support below the entry point. This, however can also be seen in the chart. Care was taken to ensure at least the risk to reward ratio of 1:1.
Sell Trade
The indicator is used to identify a sell trend and when to enter a sell trade. When the indicator moves from range 0 down to -0.1, it is an indication of a potential sell trend, thus a sell entry trade can be placed just beneath the -0.1, maybe at -0.15, just to be very sure.
The chart below illustrates.
From the chart above, we can see the area where the indicator moved below 0 range to -0.1 range. The retest of the -0.1 range was followed by a breakout from the neckline. Below the breakout candle was the best sell entry point, which was also confirmed by the indicator range. This breakout was followed by a heavy downward trend indicating a time of serious distribution.
My stop loss can also be seen in the chart above, just above the last resistance. With that, my risk will be very small. At least, you can see that the risk reward ratio should is about 1:3. That is a good profit made.
My take profit is taken at the point shown in the chart. At that place, I am already having a reward ratio of almost 3:1. Additionally, despite the fact that price was going down, the indicator was showing an upward movement, referred to as divergence. An indication of weakness of the bearish trend, expecting bearish reversal.
Kindly Explain How you Trade with a crossover signal between the CMF and wider lines such as +/- 0.1 or +/- 0.15 or it can also be +/- 0.2, identify the most important signals that can be gotten using several examples. (screenshot required)
From the foregoing, we can see that the decision to buy and sell depends on when the indicator crosses the 0 level line. If it crosses 0 level line to +0.1, it indicates a buying pressure and if it goes below the 0 level line to -0.1, it indicates a selling pressure.
If we observe the CMF indicator carefully, we will see that the neutral line is being crossed several times, thus producing multiple signals of buy and sell. These provide false signal to trader. These false signals can make a trader lose so much in the market.
So to help him avoid such situation, he can decide at which level that will suit him best in the use of the indicator without it being necessarily at 0.1/-0.1.
His constant practice with the indicator will help the trader decide the level above 0.1 or below -0.1 on which he will base his entry points.
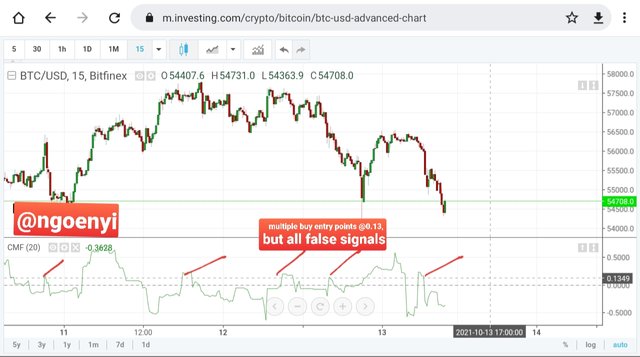
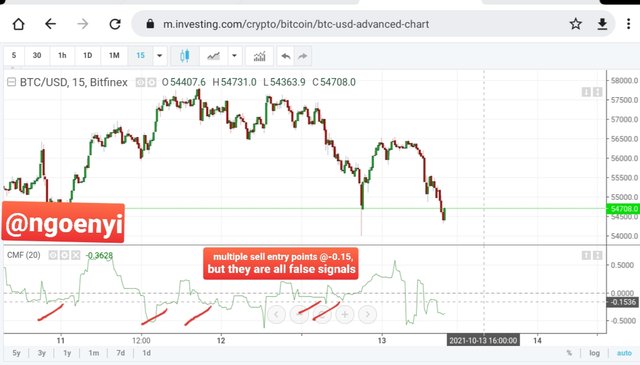
From the charts above, we see that false signals were produced constantly at 0.15/-0.16, thus the trader having known this will now choose an entry point quite above or at 2 for a buy entry and a point below or equal to -2, for a sell entry.
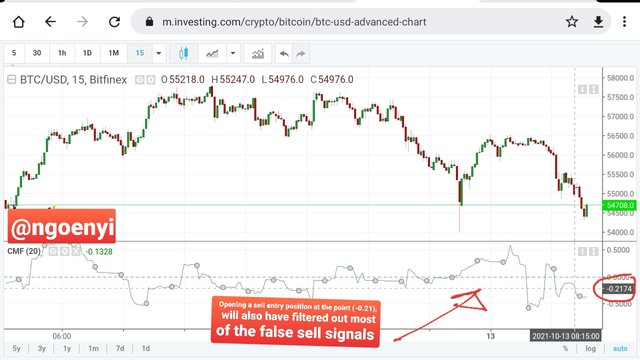
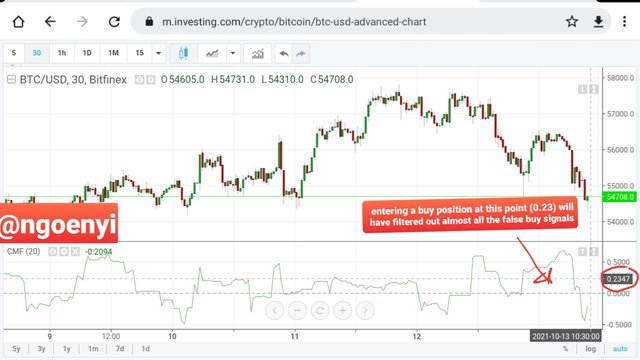
These two charts above gives us what may be a perfect signal for either buy or sell. For both entries, the CMF range is well above 0.2/-0.2 levels. At that point, most of the false signals have been eliminated, giving the trader a clearer picture of his entry points.
So from explanations above, we can deduce that it will be wise to practice with the indicator very well over time so as to know the best range to enter either a sell trade or buy trade.
Explain How to trade with divergence between the CMF and the price line? Does this trading strategy produce false signals?(screenshot required)
Bullish Divergence
A bullish divergence occurs when there is a bearish market and the price is going down but the indicator is showing an upward movement. Whenever this happens, it tells us that the end of a bearish trend is very near. Thus a bullish reversal is very imminent.
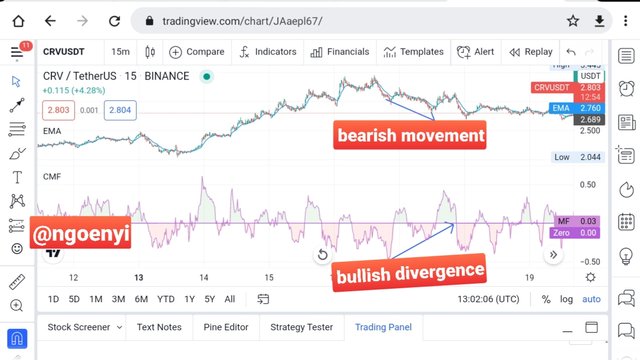
From the chart above, we observe that as price was moving down, the CMF indicator was showing an upward movement. Signaling that the downward movement is about to end. So any sell entry positions should be thinking of exiting the trade.
Bearish Divergence
This is the opposite of bullish divergence. It occurs when there is a buliish market. The price of the asset is moving up, generating higher highs and higher lows, meanwhile, the CMF indicator is going the opposite direction, giving a bearish divergence.
Whenever this happens it is a sign of imminent bearish reversal.
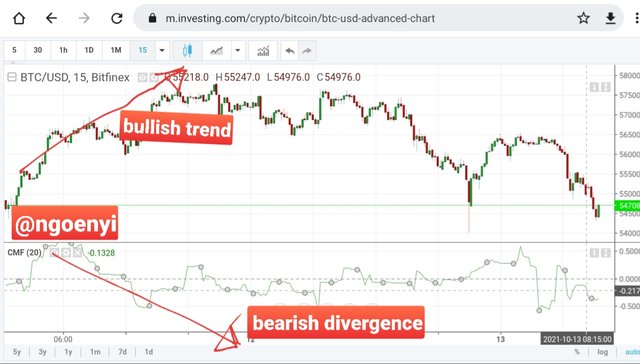
From the chart above we notice that as price was going upwards, the CMF indicator was pointing downward, which indicates a bearish divergence. Any buy position should be thinking of exiting the trade.
Once we see this divergence, it is an sign that the trend is about to change, so the trader will have to wait to ensure the market actually changed it price movement with the use of technical analysis, price action or other indicator, to confirm his entry before doing so.
Does Divergence strategy produce false signals?
Just like we have been learning concerning other indicators and strategy, no one can be 100% correct. The same is applicable to this strategy, sometimes it can provide a false signal, especially when it takes a longer time for the market to change direction, while it has already shown the divergence.
So it is best to apply the strategy along with other strategies or indicators to know the most appropriate place and time to place a trade
Conclusion
It has been cool learning about this indicator, just a little recap of what we have just discussed. The CMF indicator is a trend strength indicator that measures the buying and selling pressure of an asset. Its calculations are based on the price and volume off the asset or stock.
When the indicator have a positive value, it signifies an uptrend, but when it is negative, it signifies a downtrend.
We also learnt that the trader will know the best place to take a trade for each position after having practiced with it for sometime in order to ensure he filters out false signals.
However, it is always best to work with more than one indicator. This principle is also applicable to the use of the CMF indicator.
Thank you @kouba01 for sharing this piece with us.
Please verify my achievement 6 and send me discord Link please i want to say something..
Hello
@ngoenyi
You checked my post but did not give the title above. Please check it again.
https://steemit.com/hive-172186/@niamat1/achievement-5-task-1-or-or-the-steem-world-tools-or-or-by-niamat1
https://steemit.com/hive-172186/@ranashumiaz/5embvt-or-or-achievement-2-or-or-task-or-or-basic-security-or-or-by-ranashumiaz-or-or
Please verify my achievement 2 @ngoenyi
Hi @ngoenyi
Thanks for participating in the Steemit Crypto Academy
Feedback
Total| 8/10
This is good content. Thanks for demonstrating your understanding of Trading using the Chaikin Money Flow Indicator.
Thank you dear professor