Strategy and use of Donchian Channels - Crypto Academy / S5W1 - Homework post for @ lenonmc21
Hello everyone and welcome to yet another Week and Season in the Steemit Crypto-Academy community. today will be providing answers to the given lectures by professor @lenonmc21 on the topic of Strategy and the use of Donchain channels.

Strategy and use of Donchain Channels by @nackasnelson

Question 1
Explain and define in your own words what the Donchian Channels are?
The Donchain channels are technical indicators that provide traders with signals and also help them in making investment decisions depending on the irregularities and price change over time in the market.
Because of the irregularities in the market, the Donchain channels can be used at any time, and similar to the Bollinger bands, Donchain is made up of oscillating lines which are nothing more than moving averages changing due to the irregularities of the market.
The Donchain channels pay so much attention to the historical irregularities of the market, past signals potential breakouts, and potential reversals and it also indicates an overbought likewise an oversold signal simultaneously. This indication helps traders to make more profits and avoid losses in a trade.
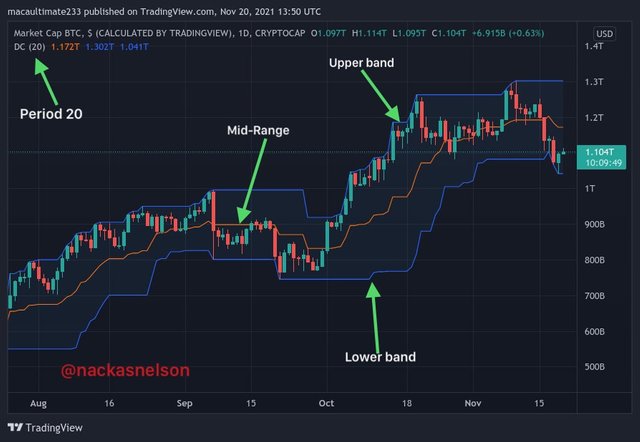
Donchain indicator is composed of three lines that represent to traders how volatile the current market is. These 3 lines indicate the Upper band which indicates the overbought region, the Lower band also indicating the oversold region, and the Mid band.
Question 2
Does it explain in detail how Donchian Channels are calculated (without copying and pasting from the internet)?
This calculation can be done by a graphical illustration where the moving average represents the average of an unknown number of periods that oscillates as time passes in the market.
The Donchain indicator then indicates an Upper band which represents the maximum value in that period and a lower band which indicates the lowest value and the Mid band indicates and represents the intermediate value which is known as the Range. This can be seen on the graphical representation below
Question 3
Explain the different types of uses and interpretations of Donchian Channels (With examples of bullish and bearish trades)?
The interpretation which traders can get and give to a market fluctuation by the Donchain channels has several important uses among a few the ones which stand out is the upward trends and the downward trends which are highly used and very common. But it has a way in which these two can be used at the point of a reversal or retracement thereby giving more importance to the mid-range.
In a market with very high vitality, this indicator expands its bands wider and on the other hand, when the market volatility is decreased and prices have a less fluctuation rate, its bands are narrower. If the price of a commodity reaches the upper band, then we will say the market is in an overbought state making the market a booming one and on the other hand, when the prices of that commodity touch the lower band, then it can be said the market is experiencing an oversold of that commodity.
Having in mind that it is always important to use more than one indicator when analyzing a trade this can be said with this indicator as it gives little information about the market. So it is advisable to use this indicator alongside some other indicators for better analysis of the price action and other related external information which can work with the Donchain channels.
 Source Tradingview
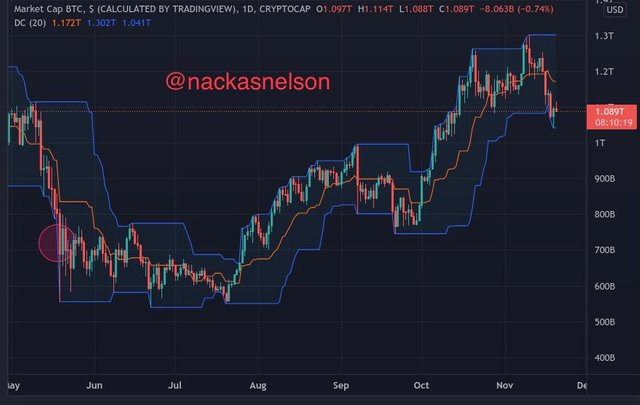
Will be using a chart to analyze the upward breakout of BTC. A contested number of candles that later change rapidly from the indicated Donchain channel
 Source Tradingview
Practical Exercise
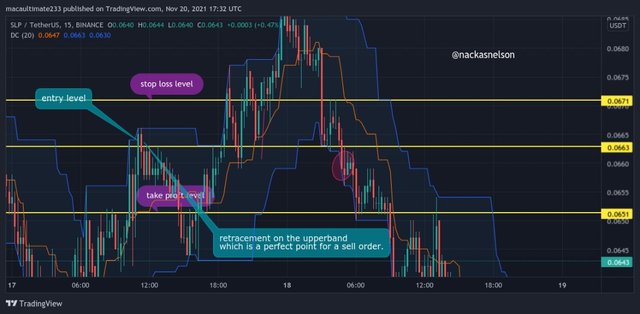
Make 1 inning using the "Donchian Channel Breakout Strategy" and make 1 inning using the "Reversal and Retracement Strategy" . You must explain the step by step of how you analyzed to take your entry and make them into a demo account so I can evaluate how the operation was taken.
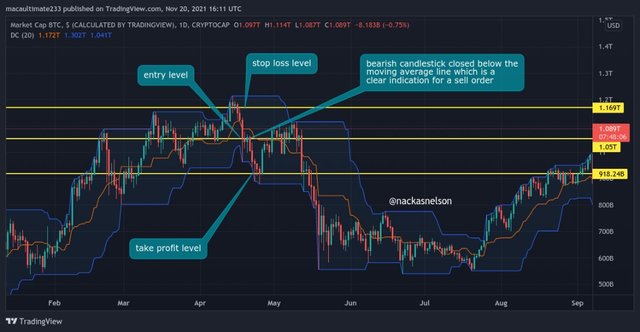
Reversal and Retracement Strategy
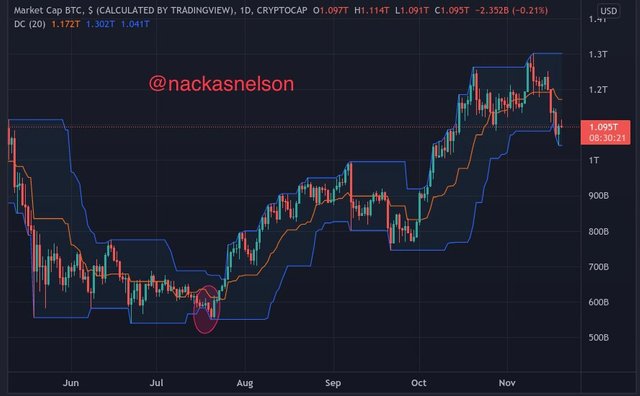
The reversal is demonstrated when we have the prices touching either the upper or the lower band of the indicator.
As shown below, we see the prices touching the lower band which acts as a support and the upper band which acts as a resistance level to the prices.
 Source Tradingview
 Source Tradingview
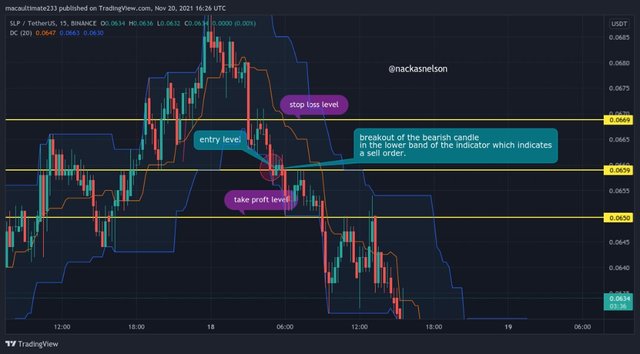
Donchain Channel Breakout
For the breakout, we the prices trying to make a breakout out of the bands, this is shown below.
 Source Tradingview
Conclusion
I thank professor @lenonmc21 for such a great topic which improves our knowledge on trading with the Donchain channel as this indicator reduces the risk in trading and helps traders to make more profit.
Cc: @lenonmc21
Sir I am eligible for Crypto academy but I have not met up with club5050 this past month I have power up more than 50% of my earnings and according to a post by prof @sapwood if any has powered up more than 150SP then he or she is eligible for Steemit Crypto Academy go read this post.