HomeWorkPost- [@sapwood] - OnChainMetrics part2
I was really excited about this and it brought a lot of new learnings for us. Well, I haven't done the first Assignment of Onchain metrics however I have gone through the previous session. I would like to use Glassnode to present the analysis of the asset.
(1) What is the difference between Realized Cap & Market Cap, How do you calculate Realized Cap in UTXO accounting structures? Explain with examples?
The difference between the Market cap and Realized Cap is very simple, let's understand what they actually mean and how it is calculated.
Market Cap
The market cap of any asset can be calculated by multiply the Current price of the Asset with the Total supply. It shows the Total valuation of any asset but it doesn't show the actual valuation as we all know there are a number of Bitcoins lost or even sitting idle in the Wallets from a long period of time. This is the typical way how can get the Market cap of any Asset. Here is the formula-
Market Cap= Current Price of the Asset * Total Supply
Suppose if the Total supply of any Asset is 1000 and the price of the asset is $0.40 then the Total market = 1000*0.40= $400. Let's have look at The total Marketcap of King (BTC).
.png)
Observation-
Marketcap: Here on the CMC the market is calculated by Multiplying the Current price with the Circulating Supply.
Fully Diluted Marketcap: It can be calculated by Multiplying the Current price with Total Supply(Max Supply of BTC).
Also you can see the Total supply of BTC is 21,000,000 however currently there is only 18,822,293 BTC are in circulation and the rest of Bitcoins are still available for mining.
Reliazed Market Cap
Realized Market cap lets us know the actual valuation of the asset. As we all there is a number of Bitcoins lost in the last 10 years especially at the begging of its birth when the value was less than a Dollar. So calculating the Market including these lost Bitcoins is not a good idea that doesn't tell the actual valuation. The calculation of Realized Market Cap is similar to Market Cap however the main difference it takes the price of Bitcoin when it was last spent or moved. Here is the formula to calculate RMC.
Reliazed Market Cap= value⋅price created[USD] (of all UTXOs)
Let suppose in the begging the Total Supply of any asset A is 100 at the begging of 2011. Let's suppose 30 coins did not in the last 2 years, 20 Coins being spent in 2014 at the price of $25 and the rest 50 coins being spent in 2020 at the price of $40. Now Let's calculate the Realized Market Cap of the asset in 2020.
Realized Market Cap= (20 * 25)+(50 * 40)= 500+2000= $2500
Here you can notice that we are not calculating the value of 30 Coins which has not been moved yet so this is how we can get to know the Realized Market Cap.
Let me show you this calculation in more detail- This time let's suppose we have 100 BTC as Max Supply in beginning. In the given chart the RMC is calculated in USD and you can see there is 20 BTC which is still idle or not being spent from the beginning

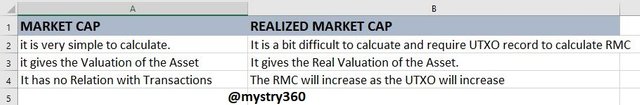
Here is the difference between MC and RMC-

(2) Consider the on-chain metrics-- Realized Cap, Market Cap, MVRV Ratio, etc, from any reliable source(Santiment, Glassnode, etc), and create a fundamental analysis model for any UTXO based crypto, e.g. BTC, LTC [create a model for both short-term(up to 3 months) & long-term(more than a year) & compare] and determine the price trend/predict the market (or correlate the data with the price trend)w.r.t. the on-chain metrics? Examples/Analysis/Screenshot?
I would like to explore Sentiment to present my analysis.
Reliazed Market Cap
As the Realized market Cap is calculated by the UTXO or spent coins. In the chart you can clearly see that the Realized Market Cap is growing in the Bull un this is because the Bitcoins are being transferred from one place to another place probably to book profits. The RMC will be flat in the case of Sideways or Bearish market the reason is people are participating less.
Short-Term(3 Months)
In this given chart you can see that I have picked that data from 21st June to 22nd September.
.png)
Observation:
In the month of June, the RMC was moving flat also the price was either going down or was in the consolidation zone after that the RMC started rising along with the Price. This was the time when btc created its low 29.0k on 21st July then started going up and made a high of 53k on 7th September. It shows the Realized market cap increase in the bull run as the public interest increases.
Long-Term(2 years)
.png)
Observation:
In the above long-term view, you can see that the RMC is increasing along with the Price also it is almost flat even if the price is doing down because the long-term investor doesn't sell their coins even they prefer to buy. this is happening because Bitcoin is a growing asset and its adoption is increasing that brings a lot of new participation in the market that increases the RMC.
Market Cap
Market cap is the total valuation of any asset and it is calculated by multiplying the current price with the Total Supply of the asset. If the supply will increase the market cap will also increase and if we have unlimited supply like the Dogecoin then we won't be able to calculate the correct market or Fully diluted market.
Short-Term(3 Months)
.png)
Observation:
You can see the Market cap has really a good correlation with the Price. On 1st July the price of BTC was 36.4k with a Market Cap of $682,179,682,729 then t started decreasing further along with the price and BTC made low of 29k around with a market cap $556,341,784,230. After creating bottom the Market cap again started increasing along with the Price and made a high of $991,255,461,732 at the time BTC kissed 53k.
Long-Term(2 years)
.png)
Observation:
You can in the long term the Market cap is moving along with price and whenever it took bottom it created a new high or we can say bull run. In the bull run, we can see the growth of MarketCap is exponential as people are buying more and more.
MVRV Ratio
In simple words, MVRV is an On-chain Metrics that uses the transparency of Blockchain to identify the Tops and Bottom of the asset. This can b very helpful for the investors to identify where to when is the right time to make the positions.
Here is the Cheat code to read MVRV Ratio-
a) If the MVRV ratio > 100% or above 1 and it is creating Higher High (HH) & Higher Lows (HL) then it will be considered as an Uptrend market.
b) If the MVR Ratio < 100% or below 1 and it is creating Lower Lows (LL) & Lower Highs (LH) then it will be considered as a Downtrend market.
Short-Term(3 Months)
.png)
Observation:
In the above chart you may notice that when MVRV is making HH, HL and the value of MVRV is more than 100% the price is moving in an uptrend where if it is creating LL, LH and value is less than 100% then the price is moving in downtrend.
Long-Term(2 years)
.png)
Observation:
The MVRV ratio works even better in a bigger time frame you can when it stopped making a new high the price dropped further and when it reverses on 22nd July the price starts moving up and made of the recent high.
(3) Is the MVRV ratio useful in predict a trend and take a position? How reliable are the upper threshold and lower threshold of the MVRV ratio and what does it signify? Under what condition the Realized cap will produce a steep downtrend? Explain with Examples/Screenshot?
Taking Position based MVRV
MVRV Ratio is an amazing On-chain metrics tool that helps us to know the trend of the market and large view of any asset. Also, it helps to identify the potential Tops and bottoms of the asset. Let me show you on the chart how it can be helpful to take a new position.
.png)
IN the chart you can see that the MVR is making Lower lower and High however once it reached to 61% which seems to be bottom and this is the time when BTC made the bottom of 29k. Why this can be considered as a trend reversal sign because in History when the last Bull run was started the MVR started making HH and HL from this 60% level.
We can think of creating a position once it stopped making a new low and started making a new high. The same way we can think of booking our profit once it starts making LL.
How reliable are the upper threshold and lower threshold of the MVRV ratio and what does it signify?
As we understand that MVRV helps us to identify the Trend, Tops & Bottoms of the Asset. In the given chart upper threshold is 3.7 and the lower threshold is 1. Above 3.7 leave is considered as Bullish zone and below or 1 zone is considered as demand zone where we can take new positions.

source
You can see whenever the MVR is coming to the demand zone and consolidating a while before taking the next leg up and once it reaches above 3.7 level supply zone begins.
Realized Cap Downtrend
RMC is calculated using UTXO so if the participation in the market will increase then the Realized cap will also increase and it will lead to a sharp upward moment in the RMC. Whenever the Fomo is created in the market and people heard about bitcoin and so many newbies come into the market and start buying Bitcoin so that happens is as Retailer we mostly buy on High and hold it... but what big players do is they used to accumulate on Place A. So even if the price started going down as human or newbie we used to hold the asset in the hope that one day it will come into the profit..png)
As the bull market begins big players start buying more and more coins to make FOMO also transfer their Cold storage coins to the Exchanges once the Fomo reaches its peak they start selling. But there are so many people who used to hold their coins rather than selling in loss and as result, the participation will decrease in the market. If the participation will decrease then RMC will b stable or downtrend.
Conclusion
On-Chain metrics is an amazing tool to identify the Insight of any Asset. We can get a clear picture in the long term however it may fail to give a clear picture in short term because of some uncertainty, manipulations in the market. Realized Market Cap and MVRV are very helpful to identify the real value of the asset and Top-bottom of the market that can also be useful for a Investor to make new Position.
@tipu curate
Upvoted 👌 (Mana: 3/5) Get profit votes with @tipU :)