CRYPTOACADEMY HOMEWORK TASK// PIVOT POINTS//#STREAM4U-S2WEEK8//@MOBIBLISS
I must say that one thing I have come to enjoy about the cryptoacademy is the intuitive lectures. It is really exposing a novice like myself to the world of crypto. Thank you more professor @stream4u, this is indeed a wonderful class.
Please permit me to present my homework task in a simple style, allowing newbies like myself to comprehend when they read through my work.

TASK 1
pivot points
Pivots points are technical analysis indicators used by traders to determine possible movement of price of an asset over different timeframe.
Pivot point therefore is a central point to determine the trend of an asset, whenever an asset price crosses that level, it is considered either bullish or bearish depending on it's movement.
It is gotten by analysing how the market performed the previous day, and it is used to predict possible market movement of the next day.
Fig 1:1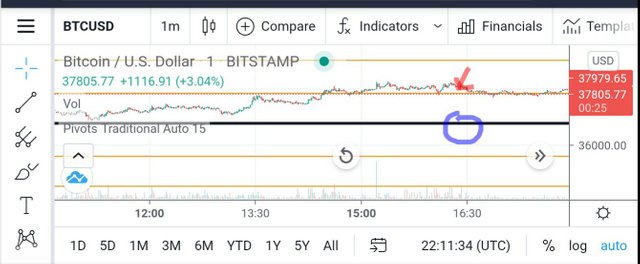
In the image above, pivot point is the black line circled blue. The orange arrow indication shows the candle chart price movement.
The pivot point is gotten by calculating the average of the previous trading day high price, low price and the closing price.
There are five major types of pivot points used by traders. They are: the standard pivot point, the Fibonacci pivot point, Woodie's pivot point, Demark pivot point and Camarilla pivot points.
task 2
Details about pivot point levels
Fig2
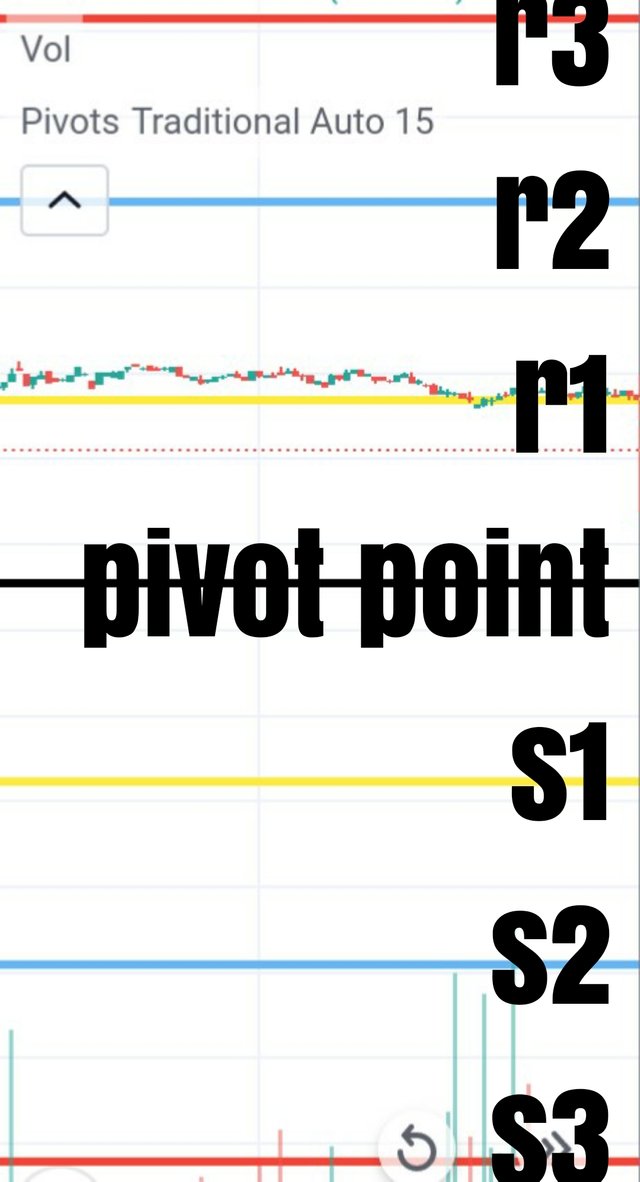
Like I mentioned earlier, pivot point is a central point from which we determine if a price of an asset is going up or down. When the chart price of an asset is above the pivot point, it is going up and we call it the bullish area and when it is below the pivot point, it is going down and we call it the bearish area
Markets tends to make seeming repetitive reversals at certain points above and below the pivot points. At the points the asset chart tend to reverse above and turn downward is known as the resistance area. At the points the asset price tend to reverse below the pivot point and turn upward is known as the support.
The lines we see drawn in the image ( fig 2) above and below the pivot point are anticipated possible areas of reversal; we see the supports lines marked as S1,S2,S3 below the pivot point; and above the pivot point, we see resistance lines marked as R1,R2,R3.
A mathematical method is applied to get the pivot point, also a mathematical method is applied to get the support and resistance. We will understand the calculations in task 3. Let us here understand the pivot levels.
- pivot point is the central black line.
- first support is the first line blow the pivot point.(S1)
- second support is the second line below the pivot point and first blow S1
- third support is the third line below the pivot point and the second line below S1
- first resistance is the first line above the pivot point. ( R1)
- second resistance line is the second line above the pivot point and the first above R1
- the third resistance is the third line above the pivot point.
task 3
calculations of pivot points, S1,S2,R1,R2
To get the pivot point of an asset, we need to get the average price movement of the previous day. To do this, we will add up the previous days high price, low price, closing price and divide it by three.
PP= ( Previous day high + low + closing price)/3.
Having gotten our pivot point, we can now calculate our supports S1, S2 and our resistance R1,R2.
S1 = ( PP ×2) - Previous high
S2 = PP - (previous high - previous low)
R1 = (PP ×2) - previous low
R2 = P + ( previous high - previous)
Let us see how we can set it up and apply it to chart.
task 4
How to apply pivot point to chart
Most platforms has already calculated pivot point as a built in indicator. We will see how to apply a standard pivot point to a chart of BTCUSD. I will be making use of "trading view."
Once at trading view, I selected my pair, BTCUSD, I chose my candles and timeframe as day time frame
Fig 3:1
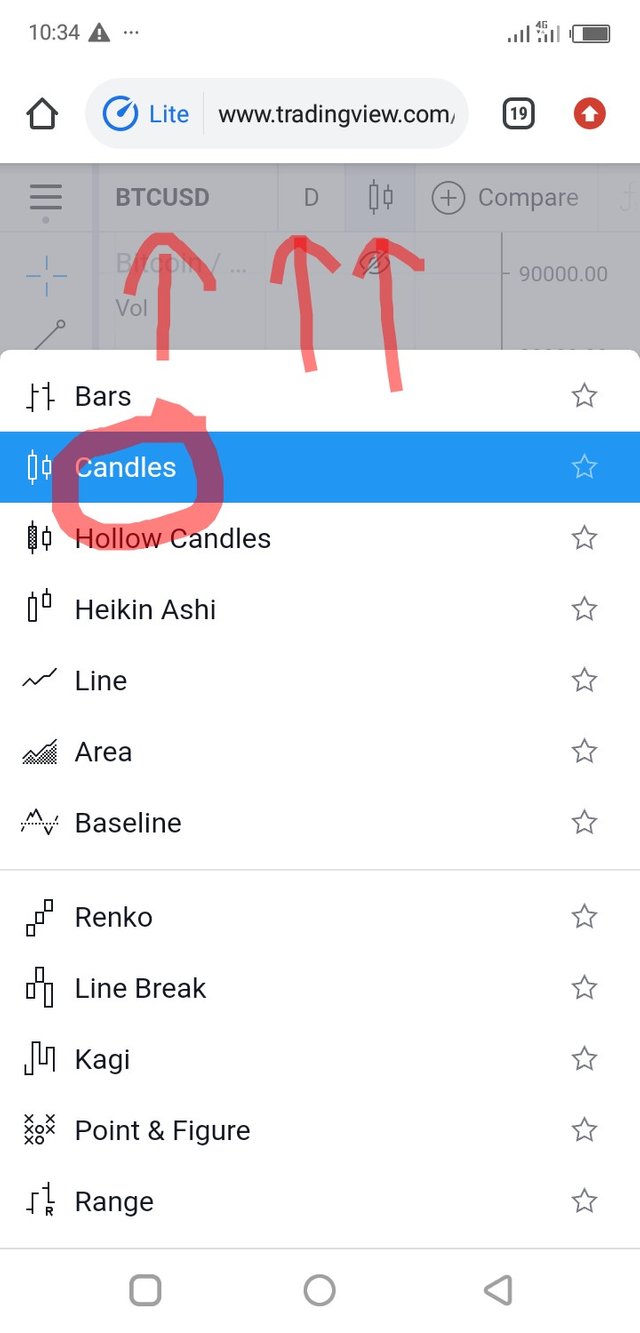
In the image the marked area btcusd shows where to select our symbols, the "D" column is where to select our time and chart option is where to select our candles.
Once this is done, we will now add our standard pivot point. To do this, goto indicators, select built inns, select standard pivot point. See image below.
Fig 3:2
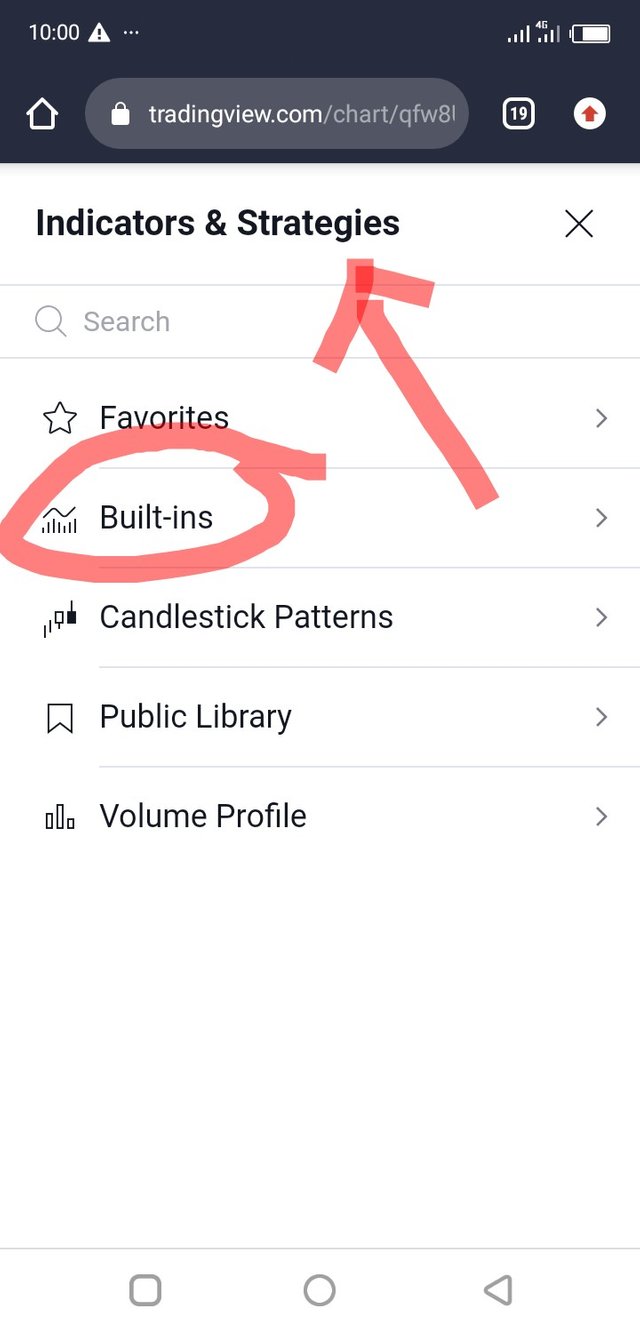
Fig 3:3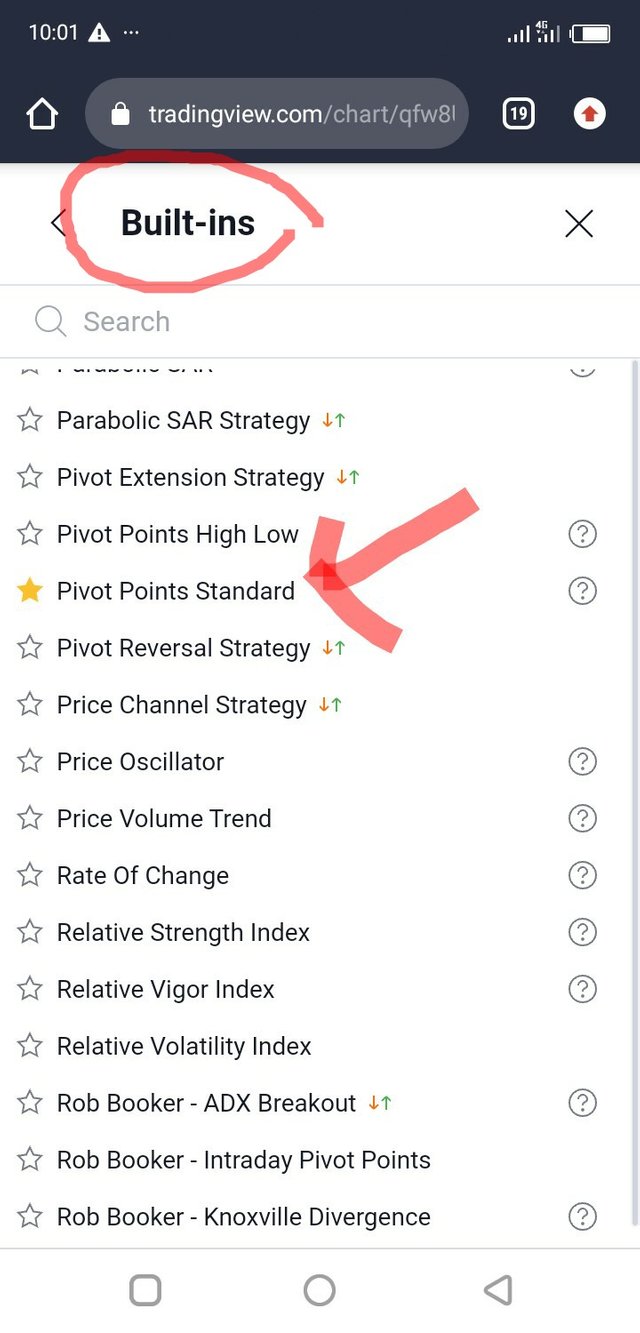
When applied, we will get our screen like this:
Fig 3:4
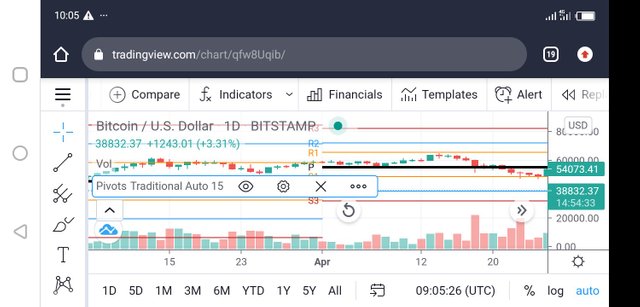
Now we will have to remove some R and S levels because we want to apply R1,R2,R3,S1,S2,S3 and equally colour it to differentiate the levels.
To do this, we will edit the applied standard pivot point levels.
Fig 3:6
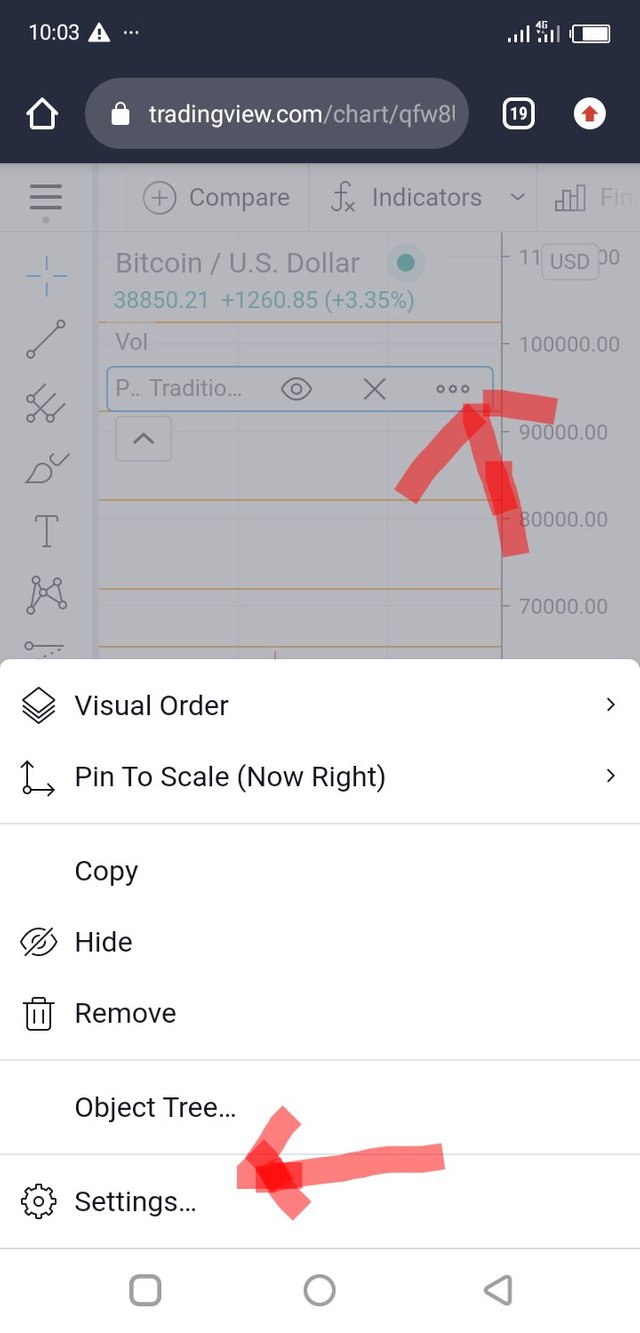
Goto settings, colour and remove unwanted R/S levels.
Fig3:7
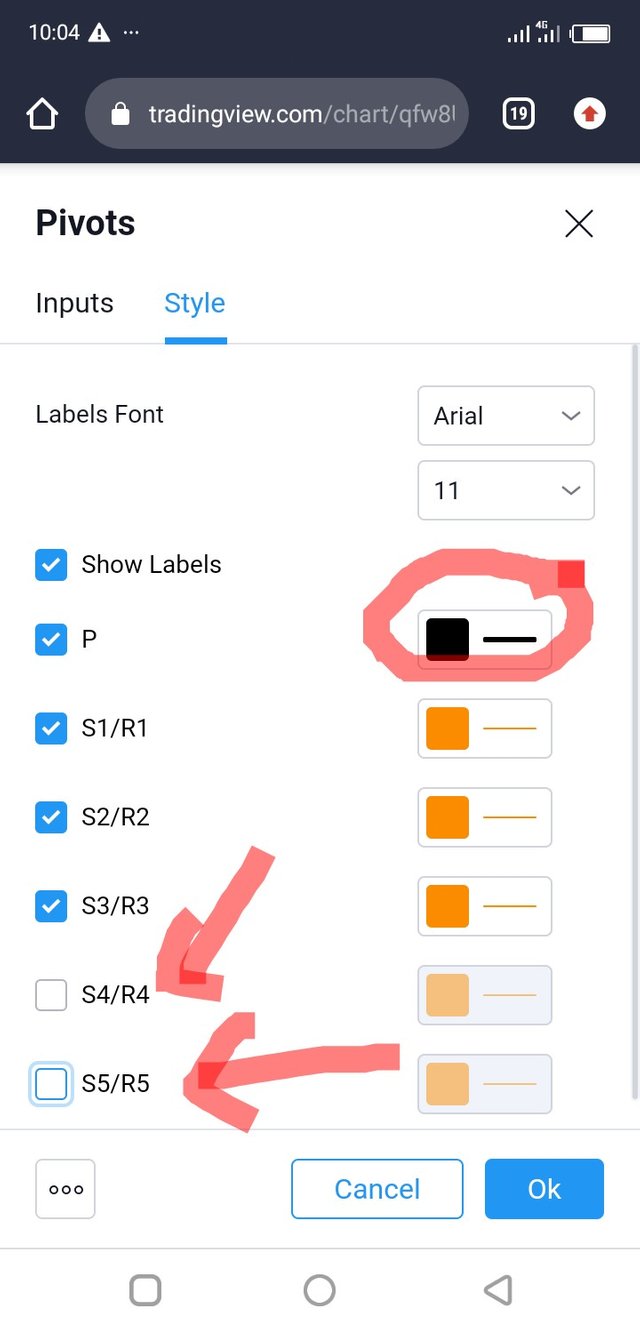
In fig 3:7 I removed R4/S4, R5/S5 and I changed the colour of PP to black.
task 5
How pivot points work
As I explained above, pivot point is like a central point differentiating the bullish sentiment from the bearish one. When an asset chart touches a resistance line, there is a possibility that the market could make a reversal. At this point a trader is hoping to trade "sell". Conversely when an asset price touches a support line, there is a possibility that there will be reversal upward, and a trader is hoping to trade " buy".
Suppose an asset chart touches for example R1 line and continues going upward, we call that a breakout; traders will hope to wait till it reaches resistance line 2 to see indication of reversal, and if it did not happen at R2 line they will wait for resistance line 3 and and same goes with the support areas.
The resistance line can be used as a stop loss limit and a take profit limit can be placed before the support and vice versa.
Let us examine how BTCUSD performed yesterday, I will point out indication from pivot point levels.
- Note: this is a mobile phone view of trading view. The image may appear more tinier. Like the other images, I have used a red marker to indicate the points I would like to make.
Fig 4
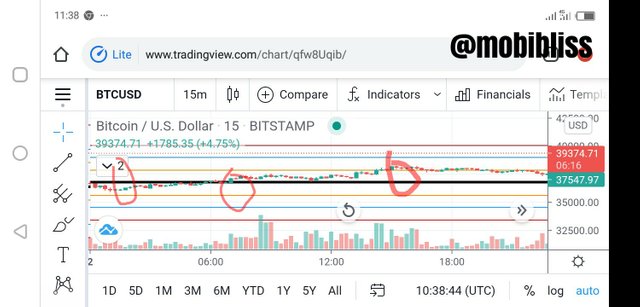
In the photo BTCUSD opened below the pivot point indicating a bearish sentiment. Coming close to support 1, it made a reversal upward. (Ist signal) towards 6:00, the asset chart has crossed the pivot point indicating change in the trend, there will be opportunity to "sell" at R1. The third marked area indicates a breakout In R1, and the asset price reversed afterward ( second signal). The day closed still on a bullish sentiment.
task 6
pivot point reverse strategy
In reverse trading strategy, our goal is to make profit as market change trend from down to up and vice versa.
One challenge facing reverse trading is the inability of traders to identify good entry and exit points. With the use of pivot points, traders can speculate more closely where will be good exit and entry points. Once the entry and exit points are established, making continual profit becomes possible.
In the below image, we are going to demonstrate reverse trading. Goal: to find an entry and exit point. The circled areas shows where we hope to enter trade and where to take profit. I have selected my crpto pair to be TRON/ USD
Fig 5.
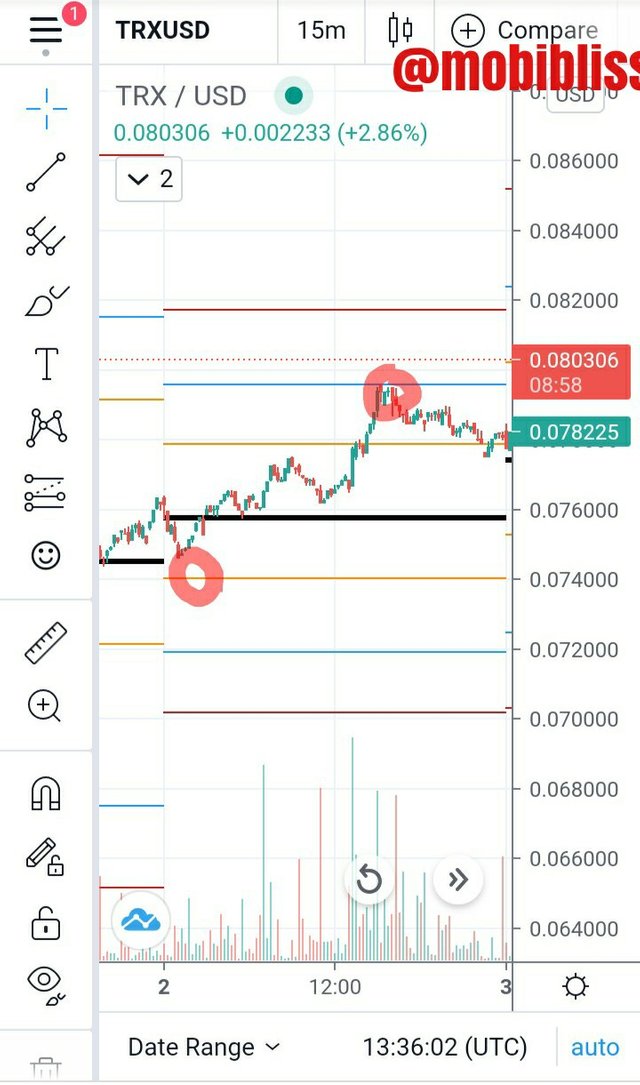
In the image above, we found our first entry point around support 1 ( S1), the day opened on a bullish sentiment with chart making a reverse to S1, market began to move back again towards up. One may be skeptical of taking a trade here, but I took the trade because the previous day,TRXUSD tested S1 and took a turn upward, without testing R1 has returned close to S1, the fake reversal would signal a long trend upward and that is what happened.
A more clearer entry point is seen at the R2 line. When the chart tested R1 it had a breakout, then a mock reversal happened before it went back up, we see a wonderful opportunity at R2.
Having established our entry, we have already mentioned that our resistance or support can serve as exit points. The key to a profitable trade is not to be greedy. It is better to be in few gains than to be at loss. So I take profit before the support or before the resistance lines.
task 7
what could be common mistakes in trading pivot points
- Relying solely on the indicator Just like other indicators, pivot point attempt to predict the future using the past. As we know, no body can predict accurately even the next 10 minutes. Therefore it is a mistake to trust solely on indicators despite how good it is. One need to know what influences the market at a point in time.
- using one single timeframe. Newbies would like to jump into the trade without proper analysis. It will be a mistake to consider only the analysis of the current chart without putting into consideration the performance of the previous days.
- greed. Greed is an issue here. Like I mentioned before, it is best to make small consistent profit than to be in loss.
- Inability to set proper stop loss or trailing loss limit
One factor that could influence this is greed. Another is lack of proper knowledge of trading. - Jumping from one strategy to another
It will be a mistake to keep testing various strategies. Stick to one, master and perfect it.
task 8
what could be the reason pivot point is good(pros/advantages)
From all our discussion we can notice the pros of pivot points.
- Easy to master Even newbies can understand pivot points.
- Helps to easily identify entry and exit points.
- It is used by many traders which makes it a good indicator.
- It has different support levels helping traders to predict price movements with more accuracy.
task 9
Apply pivot point to today's chart( the day when you are making this task) and set the time for 15 minutes. Explain market trend till the time of writing the task and how it will till the end of the day. You can give possibilities on both the side bearish and bullish
Because I am making use of my mobile phone, I will show two images. The first photo will show that the task is done today; time and date. The second image I will use to make my explanations. I have chosen TRXUSD as my pair.
Fig 6:1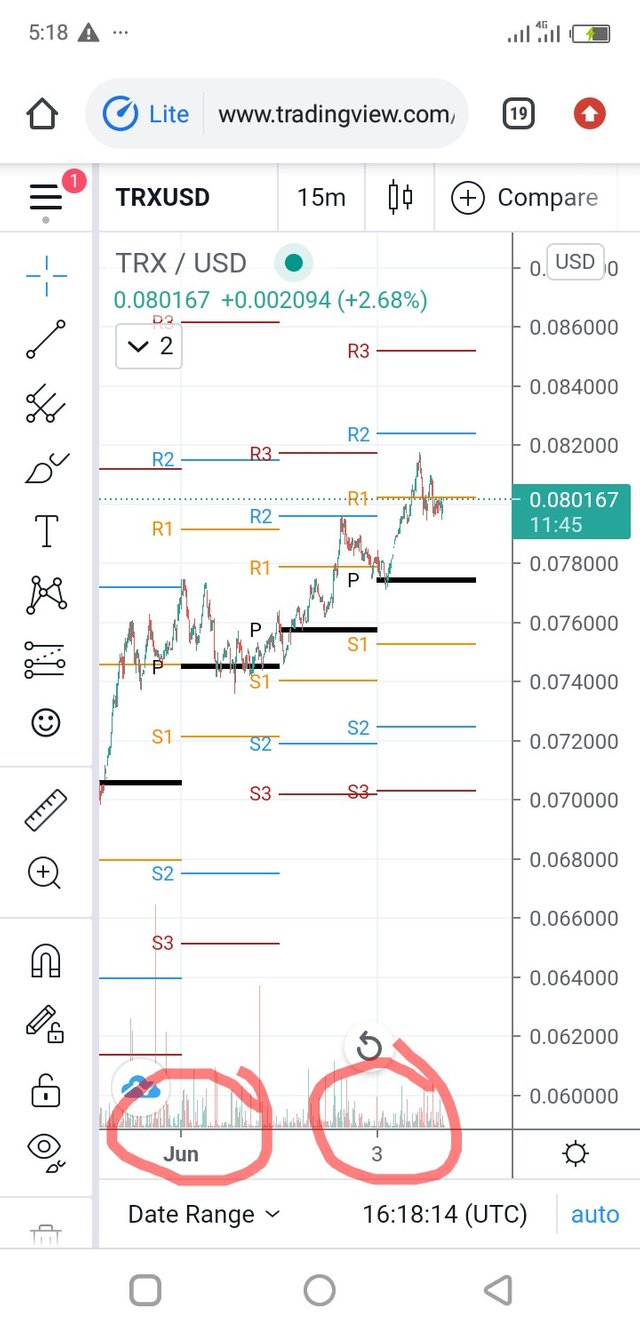
Fig 6:2
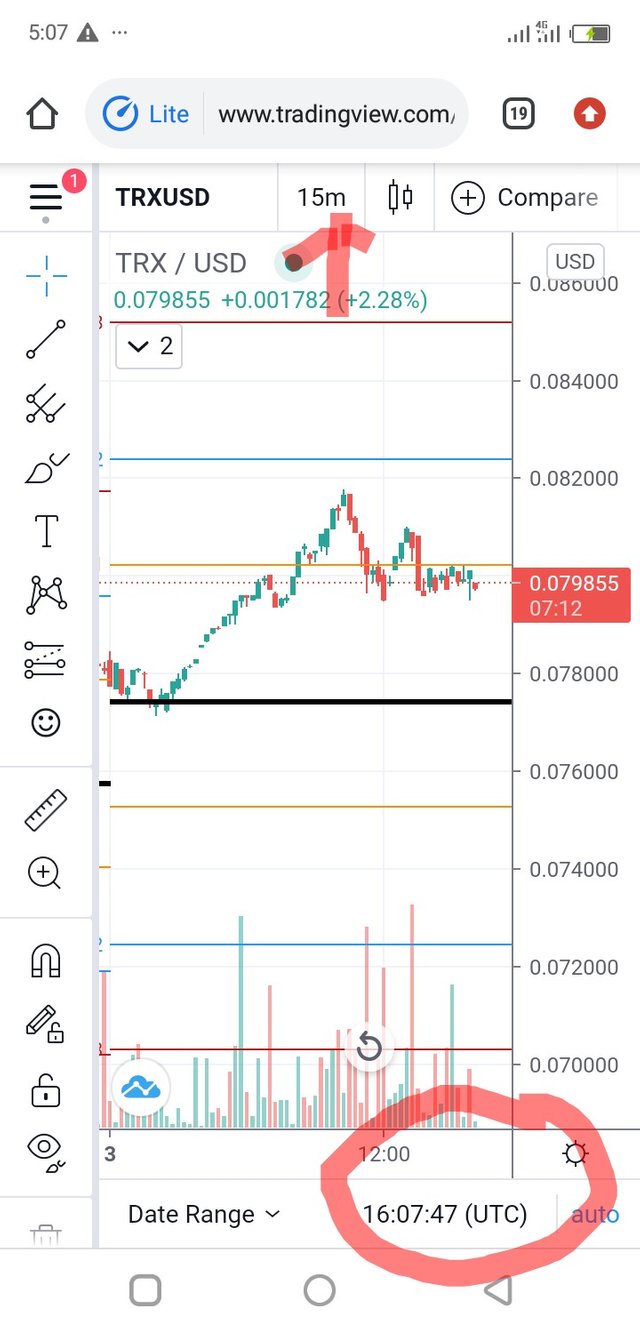
As shown in fig 6:2, I have set my chart time to 15 minutes. I have equally highlighted the chart frame for today June 3.
The TRXUSD pair began on a bullish sentiment with the price opening above pivot point. The price tested R1 towards the late morning and moved futher towards R2 line and reversed at 0.08200. Ever since the price has oscillated within R1. As at the time of writing this post the price is below R1 line. There is strong indication that the price might get close to the pp area. In Any case the price might remain in the bullish area till the end of today.
Task 10
WEEKLY FORECAST OF CARDANO (ADA) CRYPTO
Basic information about cardano
Cardano is a blockchain platform with it's native crypto coin known as ada. It is similar to etherum in that it runs smart contracts just like etherum chain.
Cardano is built on proof of stake consensus algorithm. According to cardano.org, cardano is the first blockchain to be built on ouroboros, the first peer-reviewed verifiably secure blockchain protocol.
Cardano if founded in 2015 by Charles Hoskinson, a co-founder of etherum. It was developed by three companies; Cardano foundation, IOHK and EMURGO.
**WHY I WOULD LIKE TO PREDICT CARDANO ( ADA)
Cardano native coin is one among the coins that hold high potential in 2021 and beyond.
It has a strong development team behind it's back.
The good news is how fast the coin is growing. Cardano is ranked 5 behind great coins like thether, bnb, ether, btc. According to coinpedia ada could hit $10 before the end of 2021, and it is speculated that before 2022, ada could hit $22.
Based on the daily market record of June 3, 2021 , cardano price is $1.83.
24/h low is $1.72
24/h high is 1.89.
Trading volume is $3.4 billion
Total circulating coin is 32 billion.
POSSIBLE HIGH VALUE OR LOW VALUE OF NEXT ONE WEEK
The indicator I will like to use is the relative strength index RSI.
In the image below, we will see how ada has performed this week. With the technical indicator we will predict possible price movement for next week. The RSI will tell us if ada is overbought or oversold, helping us to see possible bearish or bullish for ada coin.
Fig 7
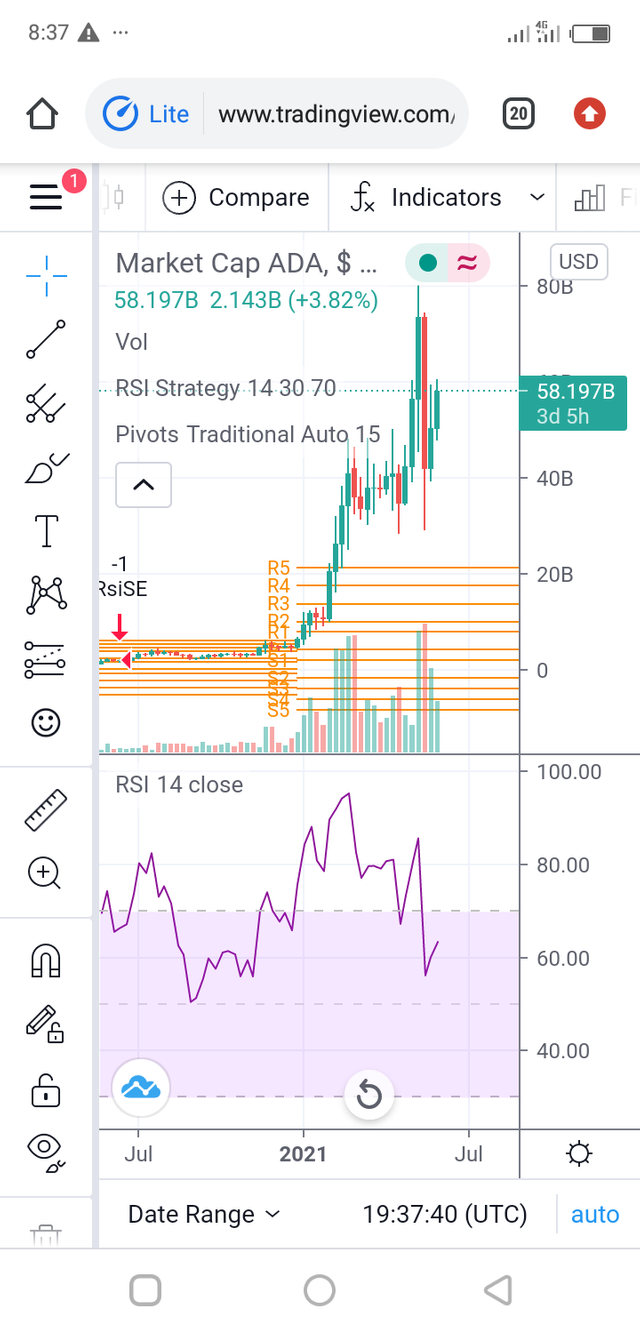
From the photo above, the RSI has been in the oversold position. It attained it's low point at 50% of the RSI and turned upward to 90%., before taking a downward turn to 60%. From what we can see from the RSI, price of ada will likely drop come next week because the RSI is still in the bullish area.
We can note same happening in the pivot point. The price chart of ada is above all the pivot levels, signifying overbought position.
task 11
CONCLUSION.
Pivot point are easy to master trading indicator. It's wide acceptance and use shows that the indicator is good.
Meanwhile we need to avoid common mistakes, like not making good analysis over longer timeframe, greed, not setting a good stop loss limit.
Using pivot point in analysing price action will lead to profitable trade.
Thank you once more professor @stream4u. This post took me time, I hope I met your requirement.
Hi @mobibliss
Thank you for joining The Steemit Crypto Academy Courses and participated in the Homework Task.
Your Homework Task verification has been done by @Stream4u, hope you have enjoyed and learned something new.
Thank You.
@stream4u
Crypto Professors : Steemit Crypto Academy
#affable