Steemit Crypto Academy Week 8 - Homework Post for @stream4u by @micheal432
My Glo Number:
Pivot point
We must have been hearing about technical analysis indicators or tools, this tools are what traders or investors use in financial markets to help them predict assets price with higher possibilities.
Pivot point is one of those technical analysia indicators that draws levels on the chart representing average high, low and closing price of previous trading cycle and helps to set support and resistance levels for the new trading cycle.
Infact, pivot means to turn at an exact spot so what the indicator does is to set resistance and support levels where it is likely for a price to reverse at. Pivot is very easy to use just like the conventional support and resistance level. This indicator also give signal of trading opportunities.
When this indicator was created, it was calculated manually but has now been automatically activated on trading platforms now most trading platforms.
PIVOT LEVELS
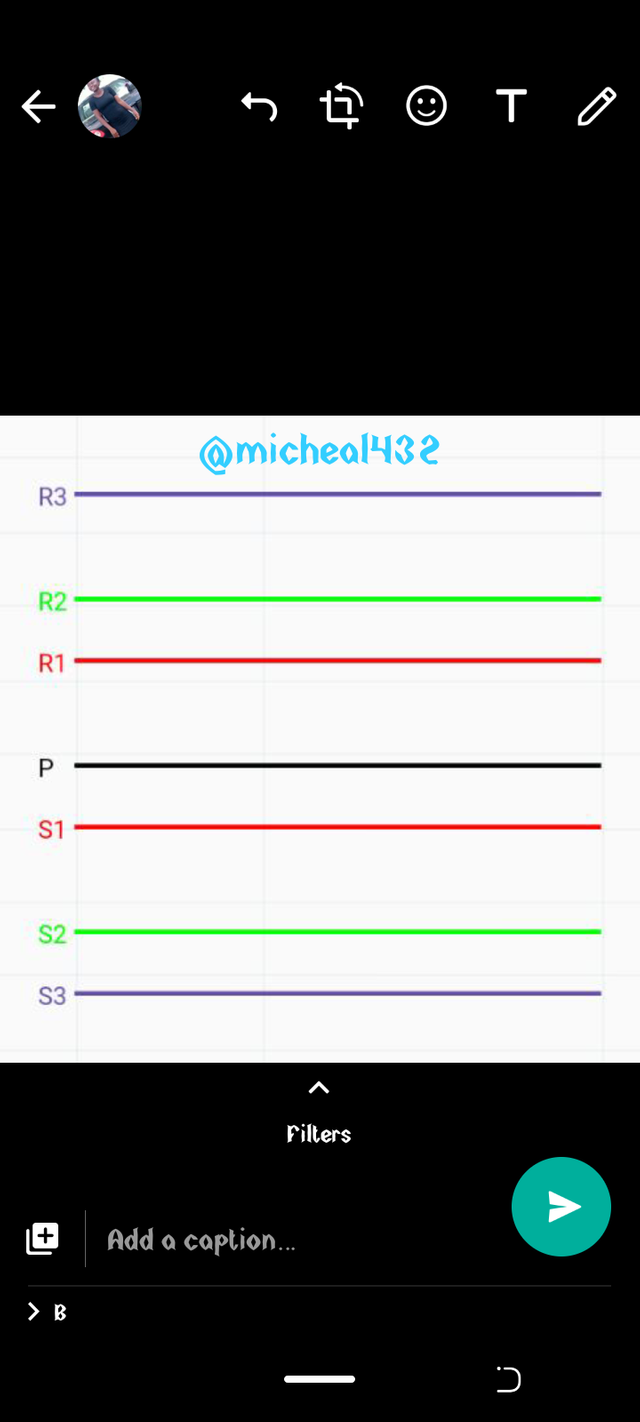
Pivot levels are stages at which the pivot indicator sets a resistance and support. The default standard level consis of 7 lines which we will be discussing below.
As seen in the screenshot above, there are 7 different lines the lines labeled R1, R2 and R3 are the resistance level and the ones labelled S1, S2 and S3 are the support level of the pivot point. While the line P is the main pivot.
Let's look at the fubction of each levels below.
Main pivot level (P) : This is the neutral level or middle level. This serves as the indicator for the begining of a bullish trend or bearish trend. When the price action rises above the p level it is indicating that there is likeliness for a bullish run and when it falls below the main pivot it indicates there is likeliness for a bearish trend.
S1 : This is the first support level which is immediately after the main pivot, this serves as the first support Whenever the price falls below the main pivot.
S2: this is the level after the S1, when the price passes the S1 level it is the next support
S3: this is the last support level which comes after the S2, if the price action passes this level then there is a great dip in the market.
R1: this is the first resistance level after the main point, it serves as a point where the price might reverse after hitting the line if it doesn't it then goes to the next level which is the
R2: the next resistance after R1 whenever the price action passes the R1 it is the next potential resistance level, if the price action also passes the level then it goes to the next level
R3: the last level on the chart, it is the highest resistance set by the indicator, if the price action break through this level also this might indicate a new overbought in the market.
HOW TO CALCULATE PIVOT POINTS
The manual method of calculating the pivot points are stated below for those who wish to learn how to calculate it manually.
Formulas for Pivot Points:
Main pivot point (P)= The main pivot point can be calculated by calculating the average of the high, closing and low price of the previous trading day. In other words that means addition of the 3 prices divided by three.
Mathematically, P = H + L + C /3
Resistance 1(R1) = subtraction of the lower price from the double of the main pivot point.
Mathematically, R1 = (2P) - L
Resistance 2 (R2) = addition of the main Pivot point with the result of the subtraction of high price from low price.
Mathematically, R1 = P + ( H -L)
Resistance 3 (R3) = addition of the high price with 2, then multiplication of the result with the result of subtracting the main point from the low price.
Mathematically, R3 = (H + 2) × (P - L)
Support 1 (S1) =double of the main pivot point subtracted from the high price
Mathematically S1 = (2P ) - (H)
Support 2 (S2) subtraction of the values of high, low and main pivot point
Mathematically S2= (P - H - L)
Support 3 (S3) = subtraction of low price from double of high price then the result is subtracted from the main pivot point.
Mathematically, S3 = L - (2 H) - P
SETTING UP A PIVOT POINT
To setup a pivot point for trading, it is done by first selecting the trading platform one want to use and then choosing a pair to trade. In this tutorial we will be using the binance exchange platform.
STEP 1
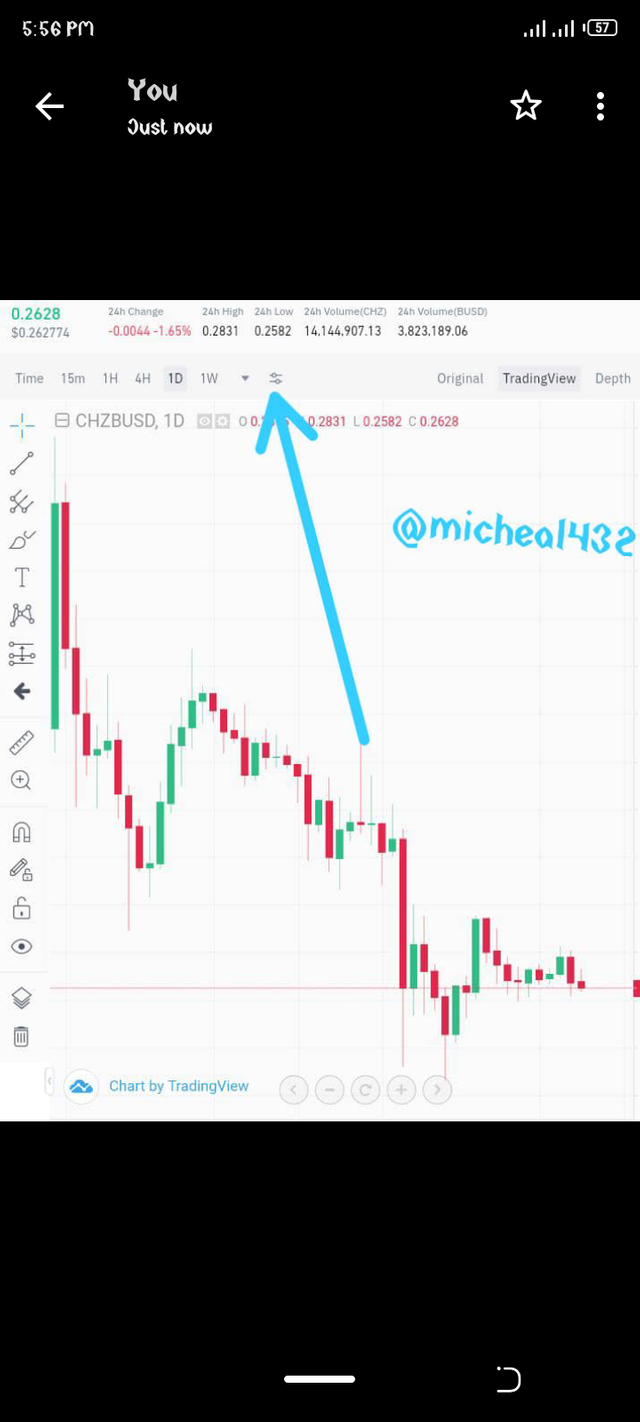
Load the binance website on your browser and select a pair in the market section. It will take you to the chart.
STEP 2
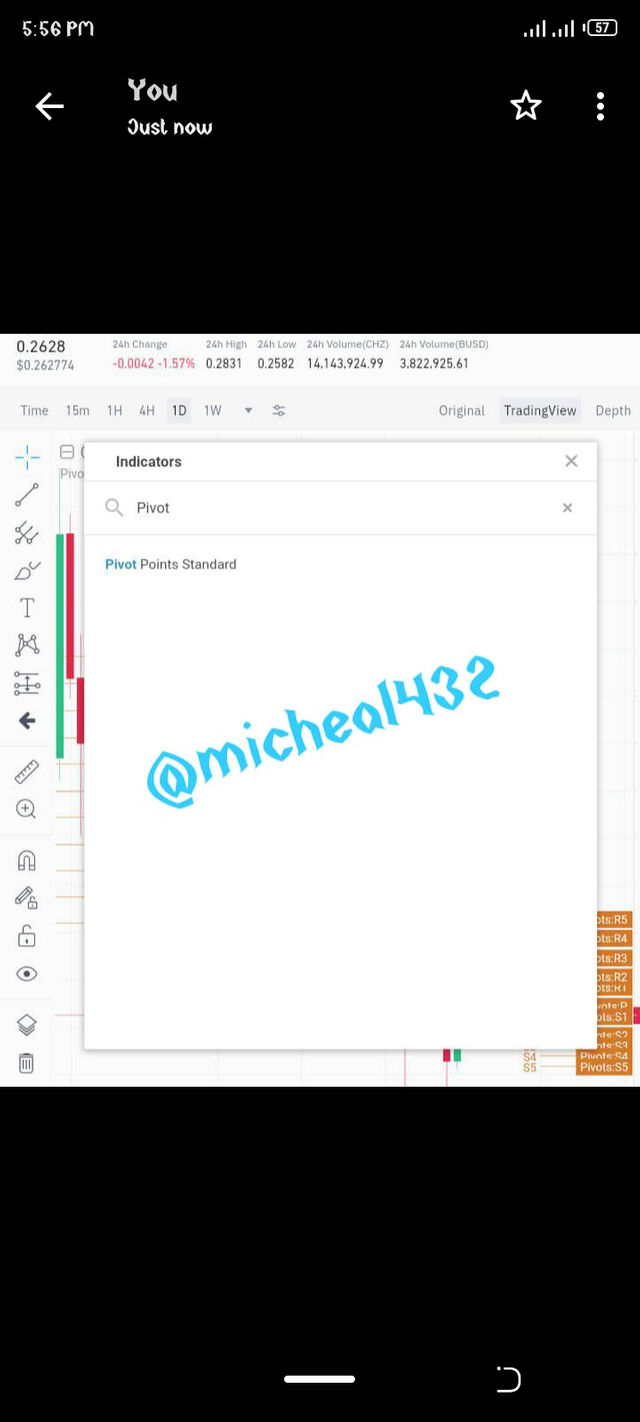
Click on the button the arrow in the above screenshot is putting at and type pivot in the search bar. It will bring out the pivot point standard click on it. You have activated it on the platform.
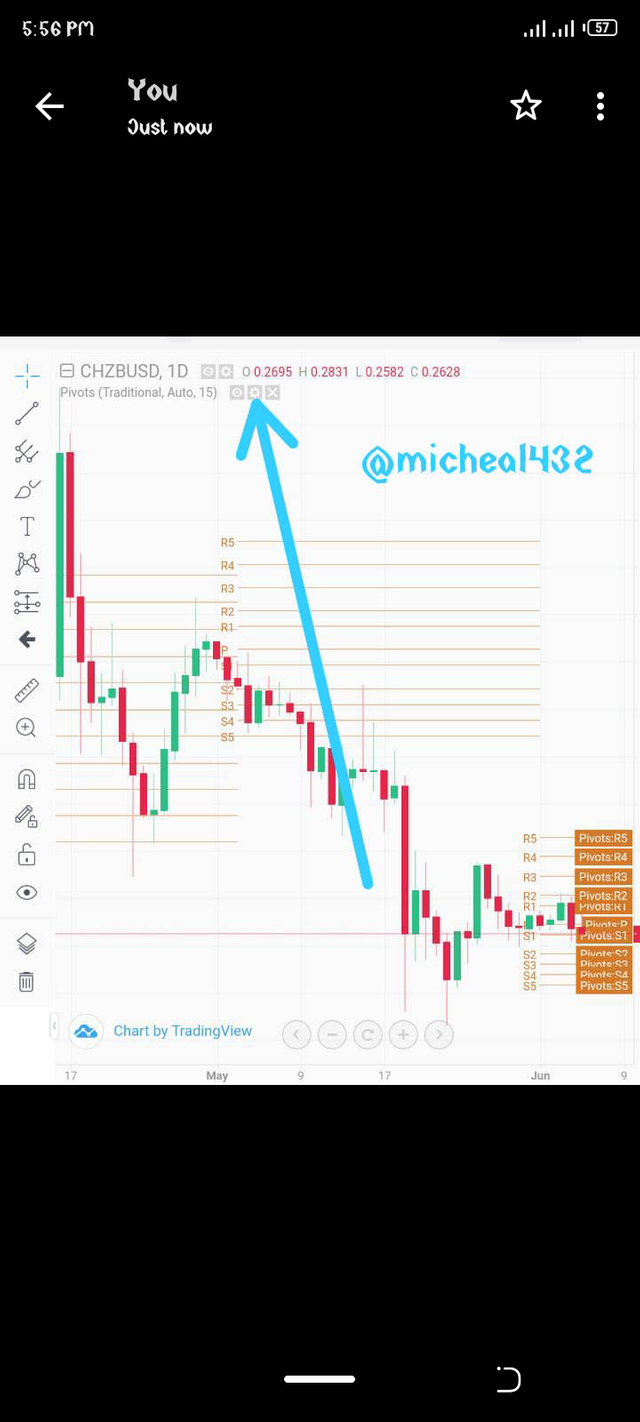
Step 3
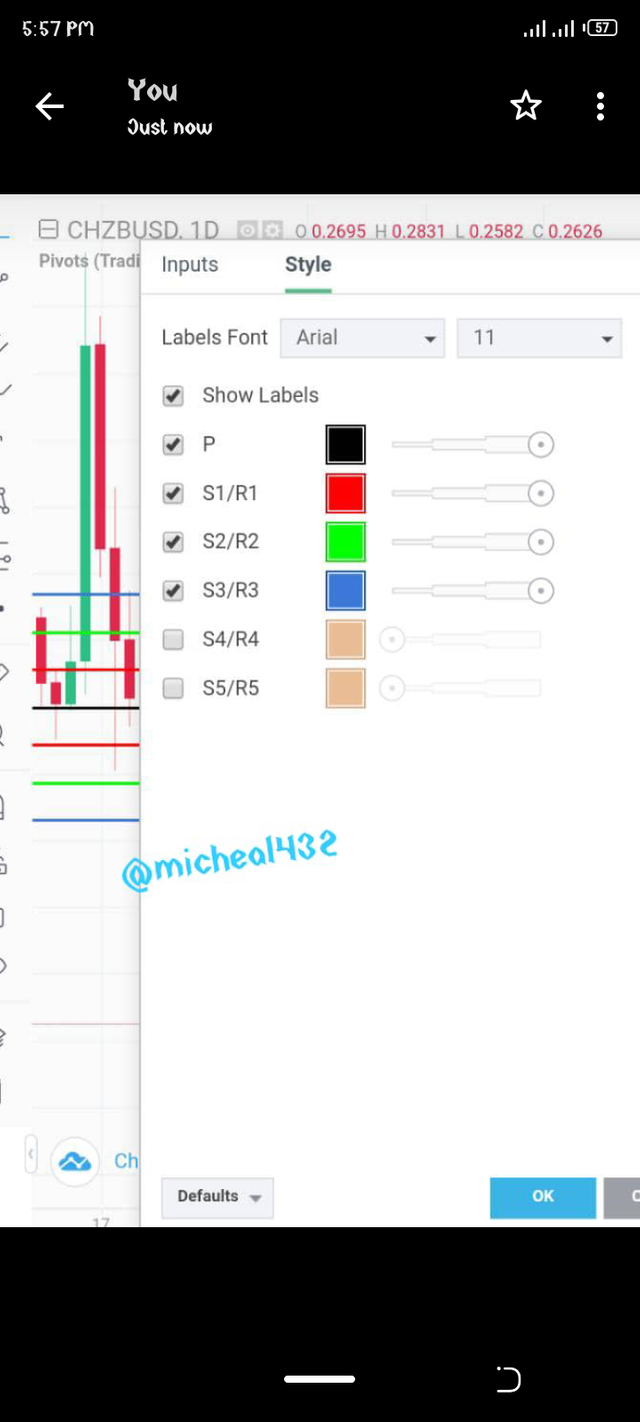
The pivot point will be loaded with a default settings which you can work with if you are satisfied and you can also modify it to your taste. The platform gives you R1 -R5 and S1 -S5, but the traditional method is S3, so it will also be modified in the settings menu.
You can also change the color in the settings. See the screenshot below for example.
How Does Pivot point work
Pivot point as said earlier in the lesson is mainly a resistance and support level indicator. It helps traders both novice and experts to set resistance and support levels. This levels can be used by traders to set an entry point, exit point, take profit and stop loss point. Let's look at an example below.

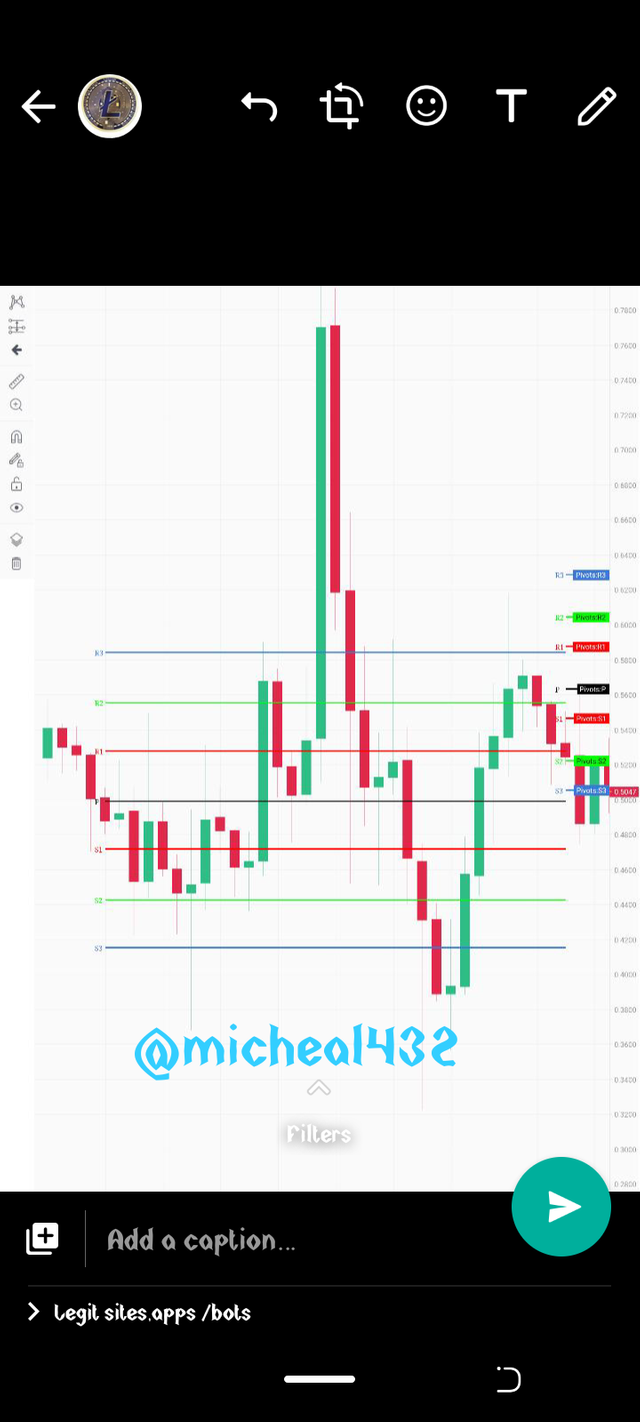
From the chart above, when the day cycle started, it started with a downtrend from the R1 level, at this point a trader will know there will be a dip in price further than it already is, the trader will wait for more dip before tapping into the market then the trader will set multiple take profit or set just one depending on the trader.
A trader can set the first take profit at P then set the next at R1 and next at R2 with a stop loss at a price in-between S2 and S3. If the trader has made this kind of trade if would have been a win win for the trader, because the market was overbought and it passed the R3 with alot of margin.
Note: it is not always easy like this. There are times when the trade might fail. No indicator is 100% risk free.
Pivot Point Reverse Trading.
A reverse trading is when the price action is overbought or oversold and then reverses back after the end of the trend. In pivot point also, one can use the reverse trading strategy
Just like this chart above we notice that there was an overbought of the asset and the price passed the whole resistance this is a good signal that there will be a reverse and a trader will wait for the reverse to start to either sell immediately or also wait for the end of the reverse to buy and wait for a rise in price again.
What could be a common Mistakes in Trading with Pivot Points
The common mistake traders make is solely depending on the pivot point alone to make trade. This indicator isn't 100% certain so it is advisable to use other indicators as well. Also because the pivot point gave levels of support and resistance a trader can also edit his or her own resistance level but just use the indicator as a guideline.
Advantages
The advantages of this indicator is to give traders insight on the possible resistance and support level at which they can use for a trade and also know where to set a take profit and stop loss.
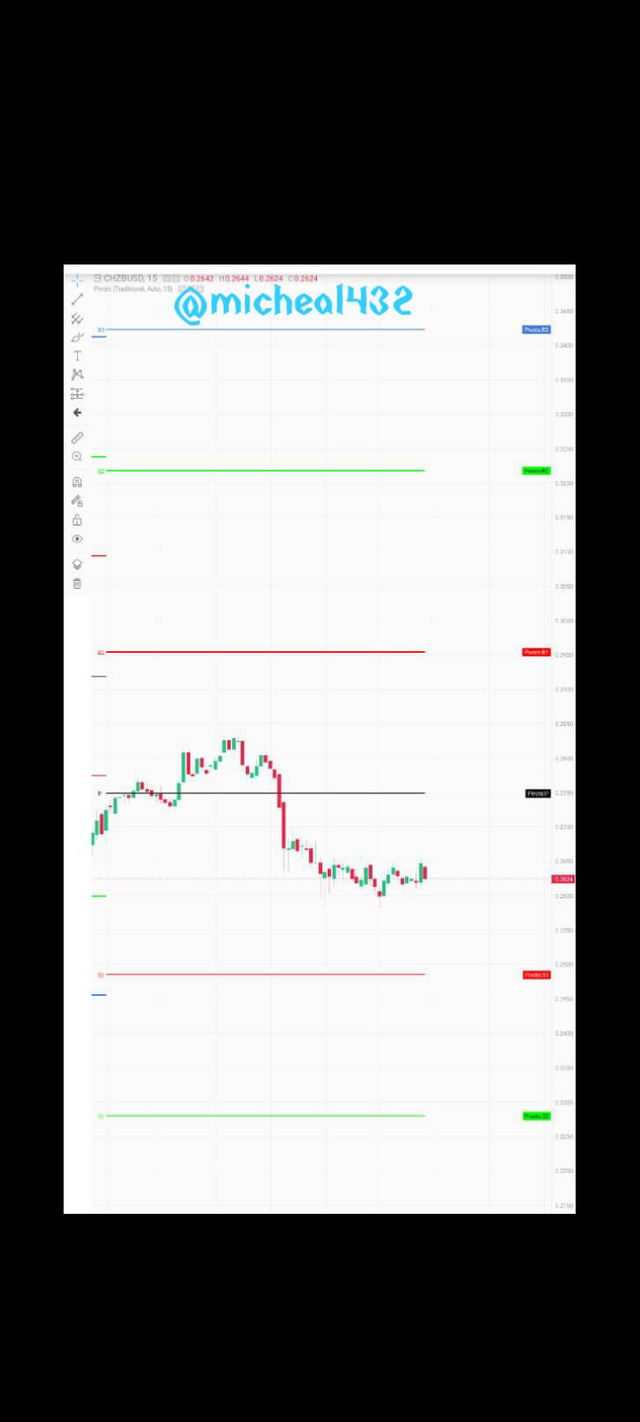
15 minutes chart review of CHILLIZBUSD
The chart below shows a 15 minutes chart of the pair ChillizBUSD. According to the chart the the price of the pair is in between the Main pivot and S1 which means the S1 is still serving as a resistance for the asset there is presently a downtrend and with the look of things the asset price will still touch down on S1 before the end of the day and rise up to R1 level.
.
Weekly price forecatse for CHILLIZBUSD
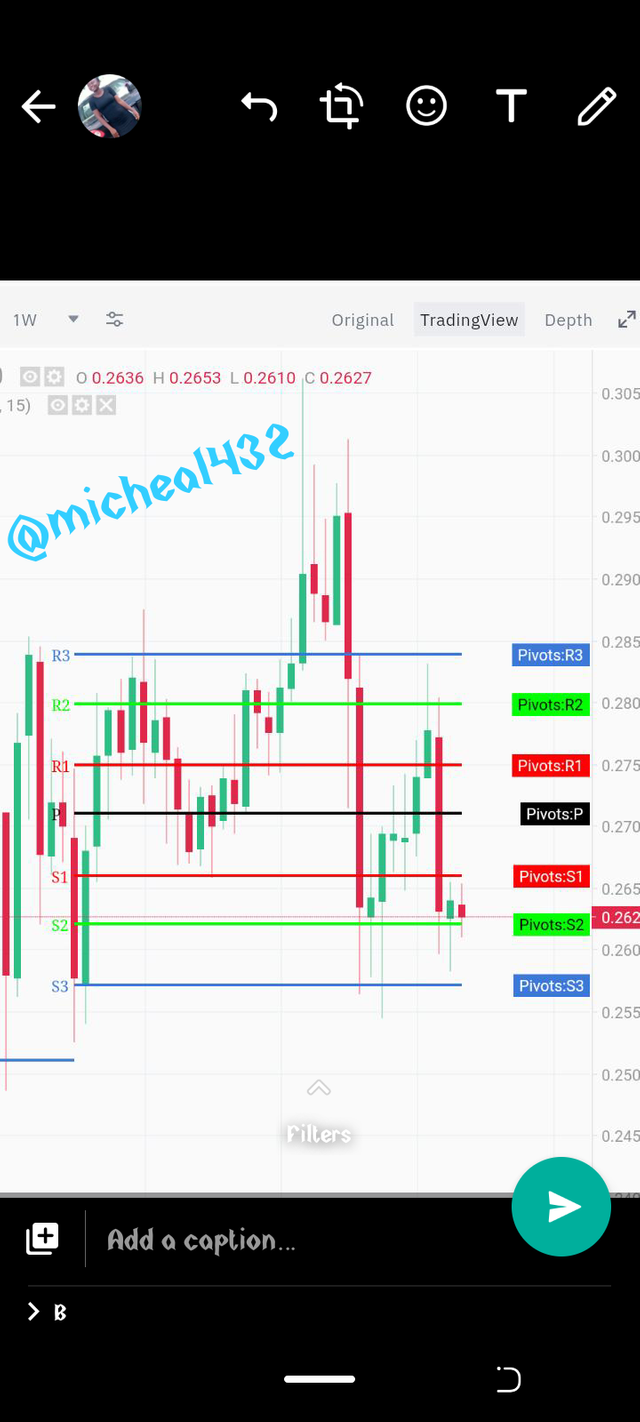
This chart shows that the pair is currently tradind at $0.262 using the S2 as a resistance level. The price has previously gone back the resistance level of R3 making $0.29 a new resistance level of the trade.
With this chart, it is obvious that before the end of the week the current support line of S3 will be broken to set a new resistance level below that price. The price will also certainly break the resistance R3 again and might even exceed the price $0.29.
You've got a free upvote from witness fuli.
Peace & Love!
Hi @micheal432
Thank you for joining The Steemit Crypto Academy Courses and participated in the Homework Task.
Your Homework Task verification has been done by @Stream4u, hope you have enjoyed and learned something new.
Thank You.
@stream4u
Crypto Professors : Steemit Crypto Academy
#affable