Homework Task Subject: Steemit Crypto Academy | Course 2 | How To Read Candlestick Charts In Different Time Frame & Information about Buy-Sell(Support & Resistance) @stream4u
Explain what is the meaning of the Green and Red candle and how to read the Green and Red candle, with candles image. (Screenshot Needed)
.png)
I'm a day trading in the crypto space and I would say trading isn't a child game it needs many disciplines and set out rules.
In general, every trading chart consists of a candlestick which is used to guide traders on price movement in the market.
The green candle indicates a bullish price movement although for any candle to be formed it has started from very small there are different parts in the candle.
Open is the first stage in any candle let's take for instance if you are a day trader you can set your candle to open a new position every 1 hour or 30minutes which means in every one hour or 30 minutes a new candle will be formed.
So in general the first stage of a candle is open.Low for movement to in green candle to low it means there have been reverse in price movement where price begins to move downward.
Close in the green candle is when the price moves up and reaches a stage where it becomes stable and begins to fluctuate then moves high up and down.
High is the highest movement that could be attained before price movement from the highest high begins to fall downward.
In other words, the red candlestick represents a bearish movement of the price which is selling.
the red candle starts from the top high and moves downward, it has four parts like the green candle which includes open; it's the first stage of movement where the candle is formed moving in a downward direction.
High; is when the price move opposite to the downward movement close; when there is price stability, low; when there is consistent movement in price downward.
Explain with Candle Chart, what are the time frames available that we can set into the chart, and why it needs to change the candle time frame? (Screenshot Needed)
.jpeg)
There are various types of trading time frame which includes 1M 5M 1H 1D 1W or 1M
there are minutes time frame, hourly time frame, daily basis time frame weekly and monthly time frame.
Different traders users different time frame scalpers use minutes time frame while day traders can use hourly or daily time frame and long term traders users monthly time frames.
The above chart is a daily time frame which means it base on hours up to 24 hours.
Show any particular asset candle chart in a different time frame and explain in short what you see in the chart, like which trend we see, what are the price levels. (Screenshot Needed)
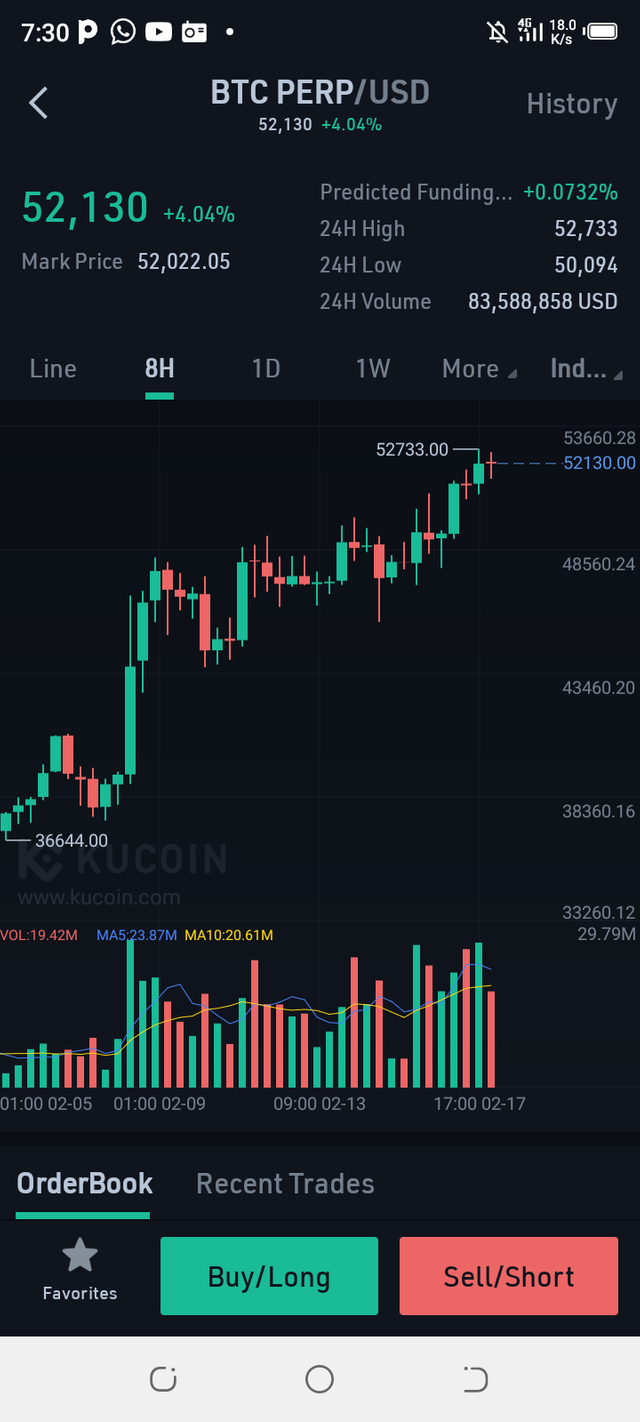
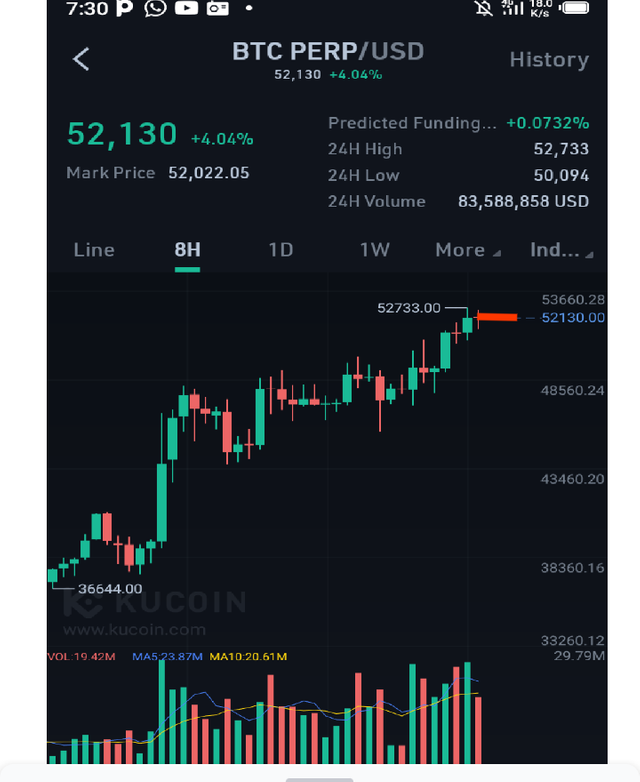
Above is a screenshot of BTC perpetual future trading chart from kucoin exchange its actually from my day trading chart, from the chart my trading time frame is 8H which means every 8 hours a new candle chart will open.
From the time frame, there has been a bullish upward movement in BTC price for about 8h but from the time of my screenshot, there is the occurrence of a new downtrend which is in a red candle.
The price level of BTC from my current screenshot was $52130.
What type of traders available in the market, explain how they work?
There are different types of traders in the market which include.
A. Scalpers; these type of traders few minutes traders that take advantage of the instant movement of the market price.
B. Day traders their traders operate with different time frames either using hourly time frame or daily they can stay much longer in the market than scalpers.
C. Long term traders these traders use a long time frame than scalpers and day traders use time frames base on weeks and months.
In trading or investing in assets, what is the importance of Support and Resistance, explain how they work?
.png)
source
Support and resistance are used by technical analysis to determine price movement it is important as it is used to direct traders on where there can be price breakout.
Support lines are always drawn where a downtrend is expected to pause.
while resistance is where an uptrend is expected to pause.
How we can find the Support in the candle chart, explain with one of the asset Candle charts with screenshot and point the levels. (Screenshot Needed)
To find a support candle on any chart will first require drawing your analysis using lines as usual support line can be sported when there is a breakout in the downtrend once the price is below the support line trader can open a trading position.
After finding Support, when and where we need to place a buy order, explain with a chart screenshot? (Screenshot Needed)
.png)
When the support line has successfully breakout it's is required for the trader to place a buy position below the support line.
Hi @mccoy02,
It seems you missed to explain Show any particular asset candle chart in a different time frame and explain in short what you see in the chart, like which trend we see, what are the price levels. (Screenshot Needed), I don't see details under this topic and then directly next topic started What type of traders available in the market, explain how they work?
Can you please provide details on this topic and complete the homework task.
Thank You.
@stream4u
Crypto Professors : Steemit Crypto Academy
#india #affable
Hi @stream4u necessary correction have been made thanks
Great.
Thank You For Showing Your Intrest in Steemit Crypto Academy
You have completed the homework task and made a good post, explained very nicely about How To Read Candlestick Charts In Different Time Frame & Information about Buy-Sell(Support & Resistance).
Remark: Homework Task Completed.
Thank You.
@stream4u
Crypto Professors : Steemit Crypto Academy
#india #affable
Thanks much for the compliment.