Crypto Academy Season 2: Week 2 || Homework post for @stream4u||
Hi everyone and welcome to my homework post for Week 2, Season 2. This was a very detailed and well explained lecture delivered by Respected Professor @stream4u. So, let's get started.
Question 1 -2.
What is Price Forecasting and why it is needed.
In very simple words, price forecasting is a technique with the help of which a user perdicts the future price of an asset.
Trading is done on the basis of price forecasting with the help of analysis made by the user. These analysis are carried out with the help of Technical, Fundamental or Sentimental methods. These methods will be discussed later in this post. Price forecasting is a method with the help of which a trader gets the clear view of the market trend. It helps in getting clear idea where to enter and where to exit the market.
In Trading world, price forecasting is very important. Without forecasting, trading is almost impossible and it can lead to too much loss for the trader. Without knowing the direction of the market, one cannot enter the market or exit any position taken. Whether trading cryptocurrency or other assets, trader has to analyze the market first and then enter the market by buying an asset. Proper trading can only be done with price forecasting otherwise it is like gambling.
Question 3.
Different methods of Forecasting.
There are three different methods that are used to analyze the market. These methods are given below.
1. Technical Analysis.
In this method, user analyse the market with the help of technical indicators. These can be Support & Resistance, Moving average, Chart analysis, price action signals, trend changing indicators etc. We learned all these things in previous classes.
For example, a trader enters the market by buying an asset at support level and exits the market by selling the asset at resistance level. These can be termed as technical analysis.
2. Fundamental Analysis.
In this method, trader does not look at chart patterns and he evaluates the market by the factors that can influence the value of an asset. These analysis are usually carried oit on the basis of financial statements of the asset and other external factors that can influence the future price of the asset. In case of any change in the management, can also influence the future price of the asset .
For example, When any institution announces to affiliate or adopt a blockchain, then it can be perdicted that that crypto asset will go upwards. This is termed as Fundamental analysis. Fundamental traders will enter the market on such statement.
Another example, Elon Musk tweets about Dogecoin and take a look at it, where it has gone from that time.
3. Sentimental Analysis.
In this kind of analysis, a trader analyze the market on the basis of news, media and other discussion in the forums. Such news create panic situation and these traders try to take advantage of such like situations. There is too much volatility involved in such situations and it s effect can be both negative or positive. In these situations, market moves very fastly and such traders earn or loose in very short time.
In this method of analysis, a trader tries to understand the sentiment of the general traders, whether it is positive or it is negative. Sudden good or bad news can aslo effect the value of an asset. This method is usually used in addition to Technical or Fundamental analysis and it can also be very helpful in analyzing the market.
Which method is better?
Technical and Fundamental analysis are the two main methods that are used to analyze the market. Both are very important and these are very helpful in trading any asset.
To me, Technical Analysis are better than any other analysis as it has proved to be very valid and are being used for years by the traders. Fundamental analysis will be helpful whenever any such situation occurs otherwise technical analysis are best for day to day trading.
Question 4.
In this section, I will try to explain how to do price forecasting with the help of Technical Analysis using different tools on chart pattern.
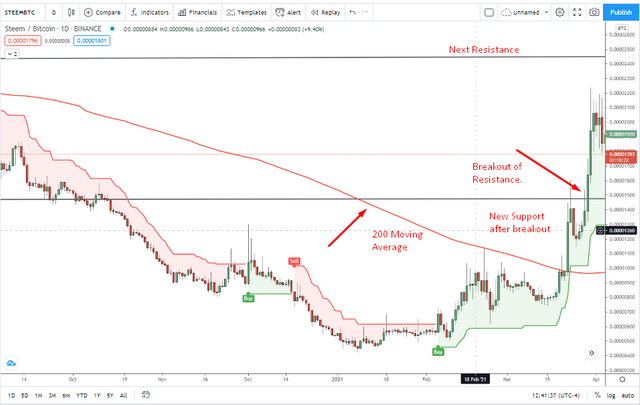
In the above screenshot, I have mentioned 200 Moving Average and new support level. After the breakout of this resistance, it is acting as Support now. I have also used SuperTrend Indicator that is indicating that steem will move upwards. Moving Average has also been broken to upwards that is also an indication of uptrend. After the breakout, market tends to move back to the new support level to test it. If it is successful in giving support, then the market again will move upwards to the next Resistance Level.
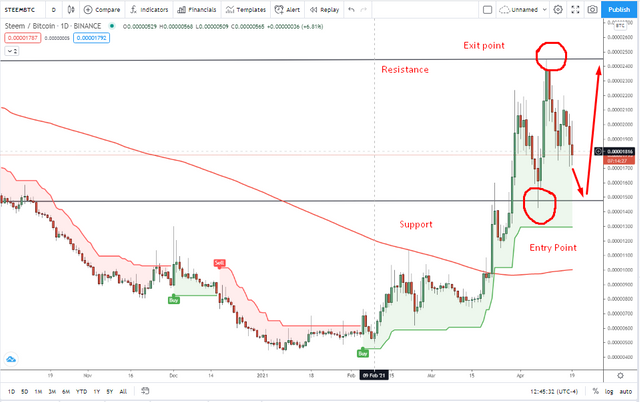
Entry point is the level, I have mentioned in the picture where trader has to enter the market by buying the asset. Support line often acts as a point where market will be rejected and move upwards. In this picture, it has acted same I perdicted and it went back to the next level that is the resistance line.
When the market reaches the resistance line, it is now the exit point for the trader because from this point market can go back to the support level again. I have perdicted on the picture that the market can touch support level again and then will move upwards again to the resistance level.
In this way, I have tried to do price forecasting and hopefully it will go according to my perdiction.
I want to give Source of my post of 06-04-2021 that was about my perdiction on steem and the market acted the same way. You can also visit my post.
Conclusion.
Technical Analysis and Fundamental analysis are both very important and these are the methods that are widely used by the traders to analyze the market. On the basis of these analysis, market price forecasting is carried out and then the traders enter the market. These are very helpful methods and without analysis, trading is nothing but loss.
Thanks in anticipation.
@stream4u
Hi @mawattoo8
Thank you for joining The Steemit Crypto Academy Courses and participated in the Week 10 Homework Task.
Your Week 10 Homework Task verification has been done by @Stream4u, hope you have enjoyed and learned something new.
Thank You.
@stream4u
Crypto Professors : Steemit Crypto Academy
Thanks sir, I will try to adopt it next time
hello sir
can u plz tell me how you draw the graph.....from where u got help
This is screenshot. I have not drawn this.
but you didnt source that. Can you plz snd me the link frm where u took this ss
THANKS
www.tradingview.com
thanks alot sir
i need some help sir
What can i do for u?
Hello sir...I mentioned you bcoz i am highly grateful to you for sharing such informative posts. i always read them and they all are the treasures of knowledge....
For that, Stay blessed
many thanks and regard
You are welcome for these appreciative words
You are definitely a hardworking man.
Thanks dear for too much appreciation.