Crypto Academy / Season 3 / Week 8 - Intermediate: Crypto Assets and the Random Index (KDJ)
Hello Everyone, so today I invite you all to read today's Homework on Crypto Assets and the Random Index (KDJ) subject which is given by Professor [@asaj].
So let us continue with our homework.
Random index:
So as we know, to enter into any market, we all need to do technical analysis, and for that, we need technical indicators. The Random index is also a technical indicator that is using to find the trend in the market, and also to find the entry and exit points for the traders. The random Index is also known as [KDJ Indicator].
So why it is also called the KDJ indicator? it is because the random index consists of 3 lines: K line, D line, and J line. Random Index is also like an updated version of the stochastic indicator, as in the KDJ indicator the K line and D lines are the lines of stochastic indicator, while the J line differentiates the stochastic indicator and the KDJ indicator. And these lines actually helps the traders in predicting the trend in the market.
So these 3 lines, makes a Random Index indicator, and when these lines cross each other or go upward and downward from each other the market makes a trend according to the lines on which they are going. And just like other indicators Like Stochastic Oscillator and RSI, the random Index indicator also told us about the oversold and overbought of the assets.
With the Random Index Indicator, we can find the overbought and oversold moments and can put our trades according to that. And to find out that if the market or the asset has been overbought, you can see the indicator going up from 80 levels, and in the oversold market we can see that the indicator is going below from 20 indicators, and we also can use the levels of 70 for the overbought market and 20 for the oversold market.
If we want to use the KDJ Indicator, the best time for it is when the market is in continuous Trend. And to see the trend in the Random index Indicator, we can see that when the J line goes above the K line and D line that means the market is in the uptrend and if the J line goes below the K line and D line that means that the market is in a downtrend.
The KDJ indicator works best when the trend is clear.
Calculating Random Index:
It is quite complex to calculate the Random Index, as to calculate that we also have to find the RSV value of the period, which will be calculated by the lowest price, Closing price, and the highest price. And then we will have to find the D value, j Value, and k Value and with all these, we can get the Random Index.
For RSV:
N-day RSV = (CN LN) / (HN LN) × 100
Source for Formula
We use the above formula, from which we can see that the CN = Closing price in the day, LN = Lowest price in the day, and the HN = Highest price in the day.
For K Value, D Value, and J Value:
K value of the day = 2 / 3 × K value of the previous day + 1 / 3 × RSV of the day
D value of the day = 2 / 3 × D value of the previous day + 1 / 3 × K value of the day
J value = 3 * k value of the day - 2 * D value of the day
Source
So for the RSV, as at default, we use the 9 lengths, so we will put that for N=9. And as there is no value of the k previous day and the value of D of the previous day, so it is recommended to use 50 in place of that.
In my opinion, as what I have learned and see is that the Random Index is pretty much reliable, and we can use it in our normal daily trades, but the reliability of any indicator usually depends on the trader, as to how he/she use the indicator, or in what parameters.
So the Random index or the KDJ Indicator was made to overcome the things which were less in the stochastic indicator. As in the stochastic indicators, there were only two lines which were the K line and the D line, and which were usually used as the buy and sell signals, but there was the issue of reliability, as usually, the trend can go into reversal, and even the reversal can change its direction, so just by seeing the buy and sell signal, it was not enough for the traders.
Usually, the signals got to change and the profit can go into loss and the loss can go into profit (which rarely happens). So to complete that space from the stochastic indicators, they invented the KDJ indicator, which also had a J line, with the k Line and the D line. As the J line shows us the current market trends.
For any indicator, a trader must know or learn how to use that indicator, to make it reliable and to use it professionally, as no indicator gives the whole 100%, but it can vary upon the user, as the one who uses the random Index indicator but don't have much knowledge about it, so the percentage of reliability for that person would be so low and when the person who has a good knowledge of the indicator, can have a probability of having high reliability in seeing the trends and buying, selling signals, and can make profits from that.
And one more thing I have noticed in usually every indicator, which I have used like RSI, ADX, MACD, and now also the KDJ indicator is that if we use it in the low time frame, it usually gives the outcome fast but not reliable, and if we use this indicator on the high time frames it mostly gives the perfect signals.
So with all these explanations, I think that the KDJ indicator is a reliable indicator to use in our daily trading, but you must have proper knowledge of the Indicator, as to how to use it, and what parameters you will be setting for the trade.
Now we will be seeing that how to add the Random Index to the chart, and what are there recommended parameters are:
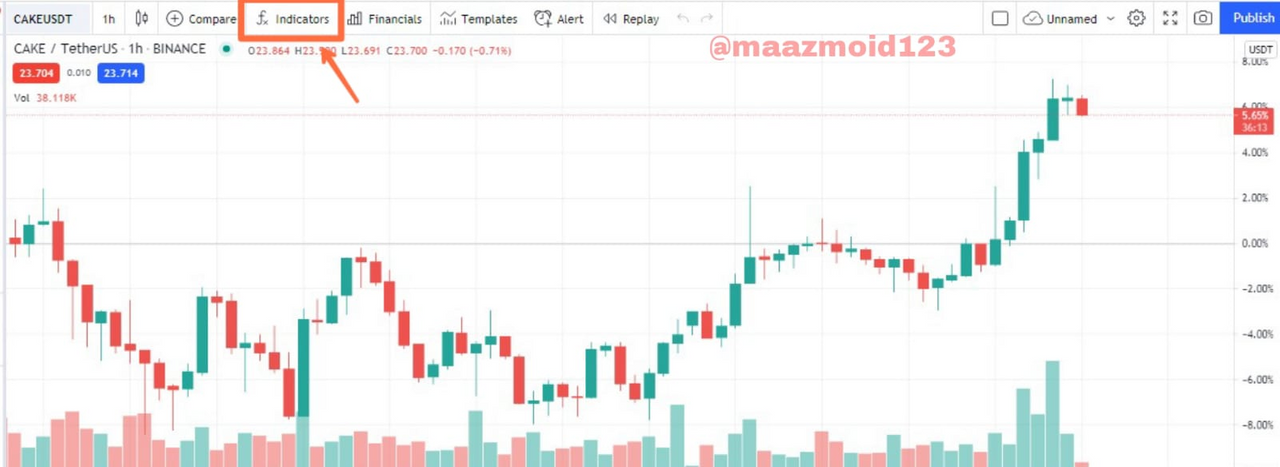
So firstly we will have to go the Tradingview.com.
Then there I will click on the chart, so go to the chart.

- There we will click on the [Fx] Indicator, as there will be the option of searching and entering the indicator.
- There we will search the KDJ and there we will see many options, so there we will click on the ll21LAMBOS21, as we have seen in the ll21LAMBOS21, has almost 2000 of reputation. So it will be a good choice, so we will click on that.


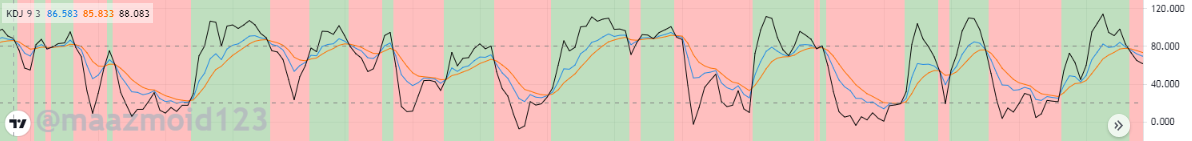
- Now we can see that the KDJ indicator is now added to the chart, and there we can see that there are 3 lines, and 2 colors, which are showing the downtrend and uptrend of the asset.

Setting the Parameters:
So as the professor has told us, and even I also have shown above that we should use the ll21LAMBOS21, on tradingview.com. This KDJ indicator is a professional type and helps the traders pretty much in trading. And there we will put the length of the KDJ indicator is 9 and the signals at 3.
Then the recommended color for the KDJ indicator lines is like, the Blue color for the K Line, the Orange color for the D Line, and the Black color for the J Line.
There are also two background colors in the KDJ Indicator:
Green color is shown when the market is in the uptrend.
And red color in the background is shown when the market is in Downtrend.
We also have to put the levels at 80 and 20, like 80 for the overbought market and 20 for the oversold market.
And we must not use the following indicator in the ranging market, as we have seen that it gives invalid signals in the ranging market. The best use of this indicator is in the time frame, as it gives it more scalability and reliability.
KDJ:
Now, we will talk about KDJ. KDJ is also an indicator, however, it has some different properties. This type of indicator helps determine the direction of the trend as well as the entry points. As its name implies, the KDJ indicator consists of three lines that are K-line, D-line, and J-line. The K and D lines are similar to the Stochastic indicator (i.e., one line is slower than the second one) while the J line is the diverging line which shows the divergence of the value of the D line from K. When these lines converge they ultimately represent the construction of a new trend.

There we also can see that in the background there are 2 colors, and there we can see that when the J line crosses the K-line and d-Line, the market goes into the uptrend, and the color of the background also change into the green color, and the same for the downtrend, as when the j line crosses k-line and the d-line and move downward, the background color change to the red color, which shows the downtrend market.
ADX:
ADX is an indicator that is used to test the strength of a trend.
It consists of a main ADX line that measures the rate at which a trend changes, and two-directional lines that help identify the strength of the trend whether the trend is an uptrend or downtrend.
When the ADX line is situated at a value lower than 25 it represents a weak trend. A strong trend is represented by the presence of ADX lines above 25 up to 50. A trend is considered a very strong trend when it is between 50-75. A very rare trend is an extremely strong trend that has an ADX line above 70.

There we also can add the DI+ and DI-, the following indicator, to make it more reliable, as the ADX indicator, shows the trend in the market just like the J line from the KDJ Indicator, while the DI+ and DI - works, same as the k-line and D line of the Random Index.
ATR:
ATR is the abbreviation of “average true range”. This type of indicator doesn't deal with the direction of the trend, rather it only determines the strength of the trend and measures the average of the true range. It is basically a volatility indicator that helps the trader to decide whether they should initiate a trade or not, as it works by showing the ability of the assets to move within a given time range.

So here as you can see that I am using the BTC/ USDT asset, and here I will going to make the buying of the asset on the Tradindview.com.

And as here above you can see that I have used the time frame of 1 day, and there I make a buy trade of 10 bitcoin, at the price of 48800, As you can see that the market is in the uptrend and the j- line is above the K-line and D-line.
So here I make a selling trade of the ADA/USDT. Where I have used the 1-hour time frame, and here as I can see that the J-line is now below the K-line and the D-line, which means that the market is now started going in the Downtrend, so it is the time to make the sell trade, so save from the loss.

I have made the sell order, of 10 ADA, at the price of $2.472. As the market is now going from the Overbought session to the oversold session in some time.
So here I am showing another buying trade, where the J-line is below the K-line and D-line, while it is also below the 20 levels, that means the market in is oversold session right now, and now I can buy the ETH at a low price in the market and then can sell it at a good price then.

I have used the 1-minute time frame, where I have bought 10 ETH at the price of $3278. And now I will wait for the price to move up to make the sell in it.
And as now we can see that the market is now in the Overbought level, or above the 80 levels, so I have made my sell of the ETH/USDT.

AS above I have shown you that I bought 10 ETH at the $32770 and then now I have sold 10 ETH at $33000, so that means I have made the profit of $ 300.
And that is how we can make the trade of buy and sell by seeing the Random Index (KDJ).
So finally in the conclusion, I want to say that it really was an informative topic and I learned a lot, that a technical analysis needs a technical indicator, to know the points from where to enter and exit the market. And the Technical indicators help in that a lot.
And no indicator is 100% reliable, but we can say it all depends on the person who is using it, as the one who doesn't have enough knowledge of the indicator, will have the low possibility of the indicator being reliable for him in trading, while who knows and have enough knowledge of using the indicator will have more possibility of having good reliability in his trading.
We see that the Random Index which is also known as the KDJ indicator is also one of its kind. It is invented just like the stochastic indicator, but the main difference in this is the J-line, as in the stochastic indicator there were 2 lines k-line and D-line where it shows the Overbought and oversold levels.
While in the KDJ indicator, the J-line also shows the Trends of the market. And just the CCI and RSi indicator, KDJ indicator also have the levels, and the recommended level to check on is the 80 and 20.
And with the help of these, we also have seen the demo of buy and sell by using this KDJ indicator.
And finally, that was all from my side. Thank you @asaj, for this informative session.
Regards,
@maazmoid123
Good job @maazmoid123!
Thanks for performing the above task in the eighth week of Steemit Crypto Academy Season 3. The time and effort put into this work is appreciated. Hence, you have scored 7.5 out of 10. Here are the details:
Remarks
Overall, you have displayed a good understanding of the topic. You have performed the assigned task excellently. However, you did not provide new information to this course, as most of the points mentioned have been indicated by several participants.
That said, this is good work. Thanks again for your contributing your time and effort to the academy.
Congratulations! Your post has been selected as a daily Steemit truffle! It is listed on rank 20 of all contributions awarded today. You can find the TOP DAILY TRUFFLE PICKS HERE.
I upvoted your contribution because to my mind your post is at least 10 SBD worth and should receive 26 votes. It's now up to the lovely Steemit community to make this come true.
I am
TrufflePig, an Artificial Intelligence Bot that helps minnows and content curators using Machine Learning. If you are curious how I select content, you can find an explanation here!Have a nice day and sincerely yours,

TrufflePigHi, @maazmoid123,
Thank you for your contribution to the Steem ecosystem.
Please consider voting for our witness, setting us as a proxy,
or delegate to @ecosynthesizer to earn 100% of the curation rewards!
3000SP | 4000SP | 5000SP | 10000SP | 100000SP
Hello dear friend @maazmoid233,I must confess that you're super good with cryptoacademy task and wouldn't be a bad professor if given the chance.
I hope you will apply for the office of a professor for the next season.
I will be glad to do your homework tasks.
You can reply me sir and also I will like to interact with you to know more about how you do your homework tasks.
Thank you for boosting up my confidence, I will really think about it.
Surely dear
I will like to keep in touch if you don't mind maybe WhatsApp or telegram or any other platform, what do you say?