[Updated] - Course 2 HomeWork | How To Read Candlestick Charts In Different Time Frame & Information about Buy-Sell | By @maazmoid123 | 100% Powerup
Hello everyone, how are you all doing? So here I am with my course 2 homework which is given by the #Steemit professor @stream4u. I had also taken part in the first one and excited about this also.
So let us begin with my Homework:
Answer:
Answer:
It is just as that cryptocurrencies values can be measured by time frame, we can see the candle chart that how any specific crypto is working and shows its prices when it goes up or down.
A time frame is an important tool to see the change in the market with the help of Candles. To change the candle time frame is needed in different aspects, as the short-term investors mostly see the 5m, 10m, and 20 mins time frame to see the price of the exact same time and long-term investors sees the month prices.

Answer:
In the below screenshot I have chosen the 15 Min candle chart and it is showing that it is in the uptrend right now. And right now it is on the Green/Light candle. This means the price is going up right now.

Now this screenshot is of 1 hr, and in here we are seeing that the price of the crypto is in an uptrend right now, and the downtrend will come soon. The candle is Green/Light right now.

Now I have chosen the 4-hour time frame, and it is showing that the price has increased a lot in this time frame, the candles are green. The red line I sketch is the support form and I think it will come back to it soon. So it is not a good time for purchasing and we should have some patience right now.

Now I have chosen the 1 week time frame and it is showing that there are resistance and support in this.

And now I have chosen a one-month time frame, In this, it is showing that the price has gone the same point where it was a month ago, and then the price dropped and it is up again. So as I have already said it is in an uptrend and we should have some patience and wait for it to go down again.

Answer:
This is what I have learned from the lecture that there are 3 types of traders available in the market which are:
Short-term traders - They are the ones who trade within a day, for like they buy crypto and then sell it again and make a profit within a day.
Long-term traders - They are the long term trader who invests and then waits for months for the crypto price to go up and then he sells them to make his profit.
Scalping traders - Scalping is the ones who jump into the market for some seconds or minutes and then jump back with some profit.
Answer:
"The more times the price tests a support or resistance area, the more significant the level becomes." And buy seeing those a trader makes his decision of buying and selling. As when the price goes down the trader buys it and it has the support and then the trader waits patiently for some time and when the price goes up the trader sells and that point is resistant.
Answer:
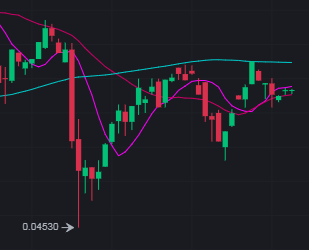
In the below screenshot you all can see the red line, that line is known as support, where the price starts then go up, and then comes back to that point. In this the price is gone up, so we have to wait till the price comes back to support point and then we will buy.

Answer:
As you all can see in the above screenshot I have explained the support and now as you, all can see that that the price is gone up, so we have to wait till the price comes back to the support point, and then we will buy.
I think this is all for my homework, I have covered all the points which the professor has given I hope he will give me a pass on that.
@tream4u, this is the entry to homework. @steemitblog, thanks once again for this initiative, I am learning a lot from this and feeling great as now I can say that I have some knowledge about these things.
cc: @ steemcurator01
cc: @ steemcurator02
Regards,
@ maazmoid123
I have updated it as you said. @tream4u
Hi @maazmoid123,
You made a good post on the Homework Task.
The post is good, but you are shown only 15 Min candle chart and explained on that. If you have seen in my post that I explained the Ethereum charts at the same time but with a different time frame of candle chart 5 min, 15 min, 45 min, 1 day. If you also shown the chart in different frames and explain accordingly so It will look more good. But, it is fine now. It's Good.
Thank You For Showing Your Intrest in Steemit Crypto Academy
You have completed the homework task and made a good post, explained very nicely about How To Read Candlestick Charts In Different Time Frame & Information about Buy-Sell(Support & Resistance).
Remark: Homework Task Completed.
Thank You.
@stream4u
Crypto Professors : Steemit Crypto Academy
#india #affable
@stream4u I have added what you wanted. Thanks
Tweet