Crypto Academy Week 16 | homework post for @stream4u | technical indicator: pivot points | by @loveth01.
PIVOT POINT
Just as the name implies the pivot is a reference point, it is used to ascertain the crypto market price movement at different time intervals, it is the mean average of the market highs , lows and the closing price. So we can therefore say that the pivot point is the point above which the market is bullish and below which there is a downtrend or a bearish run. The pivot point gives insights concerning the resistance levels and support levels of the market. It is determined by utilizing the exchange information from past exchanges at certain time stretches, with intent on attempting to anticipate future pattern or trend reversals.
THE PIVOT POINT LEVELS
Next we will be looking at the pivot point level; the pivot point level is sectioned into two parts which are the resistance level and the support level.
RESISTANCE LEVELS: the reversal level refers to a point where the cryto market trend is to move in the opposite direction i.e experience a downtrend after experiencing an uptrend. The resistance levels are for the most part an overbought district as more users purchase coin, in light of the fact that they are drawn in by the upswing. The levels of resistance can be ascertained and apparently, it is not generally right and it could be broken in light of the suspicious ideas of the cryptocurrency market.
Below are the resistance levels of the pivot point:
1)R1: the R1 is refered to as the principal level of resistance, and this is a scenario where the cryto market is supposed to move from an upward trend to a downward trend and if this specific support level is exceeded, more bullish or addition in price proceeds .This is the point whereby an investor sells their positions.
2)R2: This is the subsequent resistance and like the R1, it is a point where the crypto market is supposed to move from an upward trend to a downward trend, and if this subsequent resistance is broken, more bullish pattern follows.
3)R3: This is the third resistance level whereby a pattern reversal is expected after a long uptrend . This level, similar to the previous resistance levels is an overbought area.
SUPPORT LEVELS: this refers to the points along a downtrend or a point at the start phase of an upturn and a point whereby a pattern is supposed to be bullish .This levels are for the most part an oversold region. The market may not generally be as predicted so the support levels have strata’s as well. The support signals are:
S1: This is a point along a bearish pattern where it is normal that the market trend turns around and bullish trend begins .This first support level is when to purchase or go into that specific market. However, things may not go as arranged, and another support level is essential.
S2 : This is the subsequent support level where ,similar to the first , the market is predicted to go on a bullish pattern after a potential downtrend and furthermore even this may not be accomplished and another support level might be required.
S3: This is another support level whereby a pattern inversion to a bullish pattern is foreseen after a potential bearish pattern . This support can be broken and more misfortunes follows.
PIVOT POINT CALCULATION
The pivot point, P =( H+L +C) ÷3
The primary resistance level ,R1 = P + (P − L)
The principal support level ,S1 = P − (H − P)
The subsequent resistance level ,R2 = P + (H − L)
The subsequent support level ,S2 = P − (H − L)
The third resistance level ,R3 = H + 2(P − L)
The Third support level , S3 = L − 2(H −P)
Where:
P is the pivot point
H is the high
L is the low
C is close
APPLYING THE PIVOT POINT IN A CHART
To apply the pivot point to a chart, the below procedures should be meticulously followed: for this illustration we will be making use of tradingview.com
1 . Open the chart of any pair on the tradingview website

2 . scroll the top of the graph and select the indicator icon
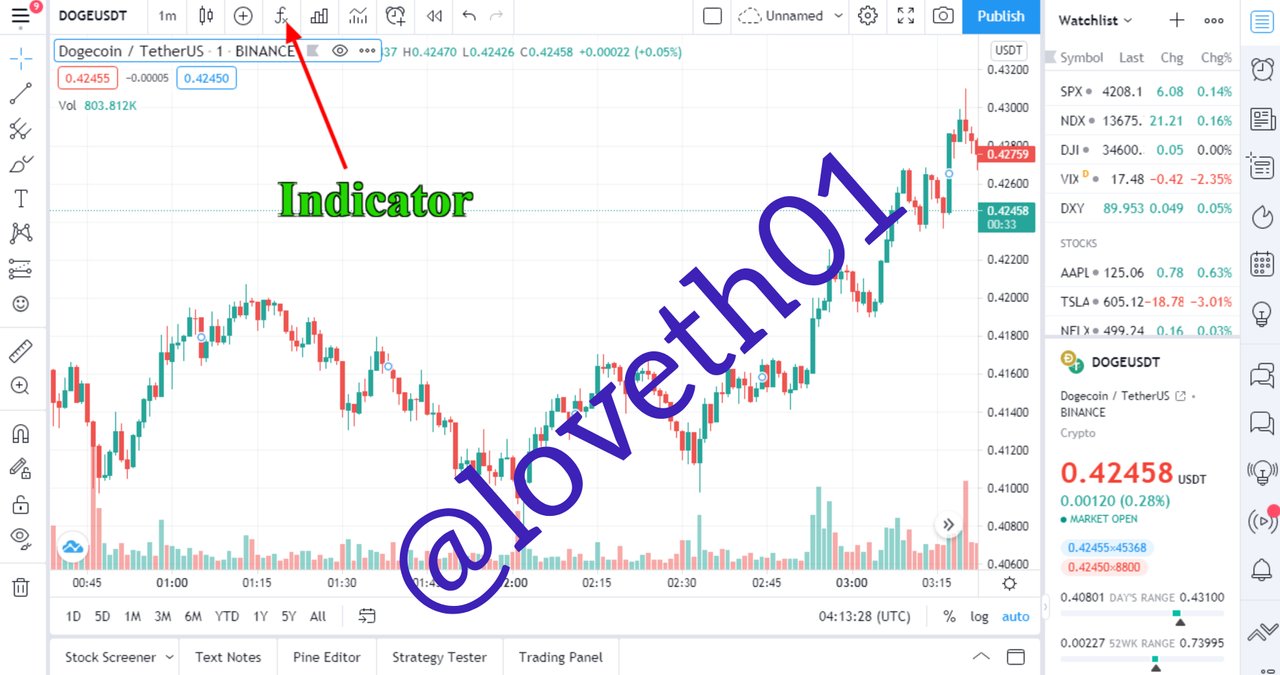
3 . Click on the built ins

4 . Select pivot point standard.


HOW PIVOT POINT FUNCTION
The Pivot points make use the trade history of past trades to tell the current or future resistances or support in a given cryptocurrency market. This pointer is probably the most seasoned marker used as it shows resistance and support signals at various levels, which informs the user when best to go into a specific market; from the support signals) and when best to leave the market; when the resistance level isn't broken .
PIVOT REVERSAL TRADING
It is important to have the option to decide when to enter and when best to exit and how best to leave that specific market. So pivot reverse trading is the talking of benefits; that is leaving the market once the resistance signal of the pivot point isn't broken. This can be done in two ways : leaving when a bearish trend is expected or entering when the support levels are not broken and an uptrend is expected to follow. So, the pivot reverse trading is the utilizing of the different support and resistance signals which are shown by the pivot point indicator , to keep away from losses; for identifying great entry and exit points.
MISTAKES WHEN USING PIVOT POINTS
In using the pivot point it is important to note that despite of the fact that it is one of the most well-known markers, it cannot be depended upon absolutely. Actually like other specialized markers, in light of the fact that it just mentions to us what may happen dependent on history and history may not generally be constant.
When setting the pivot points, the different support levels ought not be excessively far separated, same thing goes for the Resistance levels . At the point when the signs are excessively far separated, one may not rush to identify the trend inversions , thereby missing chances to make great gains.
Bad information on the interest and supply standard: Many dealers have the thought that since they are utilizing a specialized marker, nothing can turn out badly and the market simply go as anticipated, however that isn't accurate. In actuality , the lone sure approach to foresee the price of a coin is to run a fundamental analysis; check for the genuine real live adoption of the coin and how the volume of the coin is being reduced or checked.
ADVANTAGES OF THE PIVOT POINT
1 . it assists with detecting trend reversals: This indicator is viable; yet not generally precise, in distinguishing when the market will change direction. On account of its different support and resistance levels, it makes it truly adept at identifying a trend reversal even after the first or second resistance and support levels are broken.
2 . It is not difficult to Use: The pivot point of a specific market can be determined by basically taking the mean of the past high, low and closing price( (HIGH + LOW+CLOSSING PRICE)/3) , despite the fact that we have platforms that can figure it out digitally, it is still simple to compute manually.
DISADVANTAGES OF THE PIVOT POINT
It is not reliable: we are not sure that the price will either stop, go back or even get to the point made on the chart
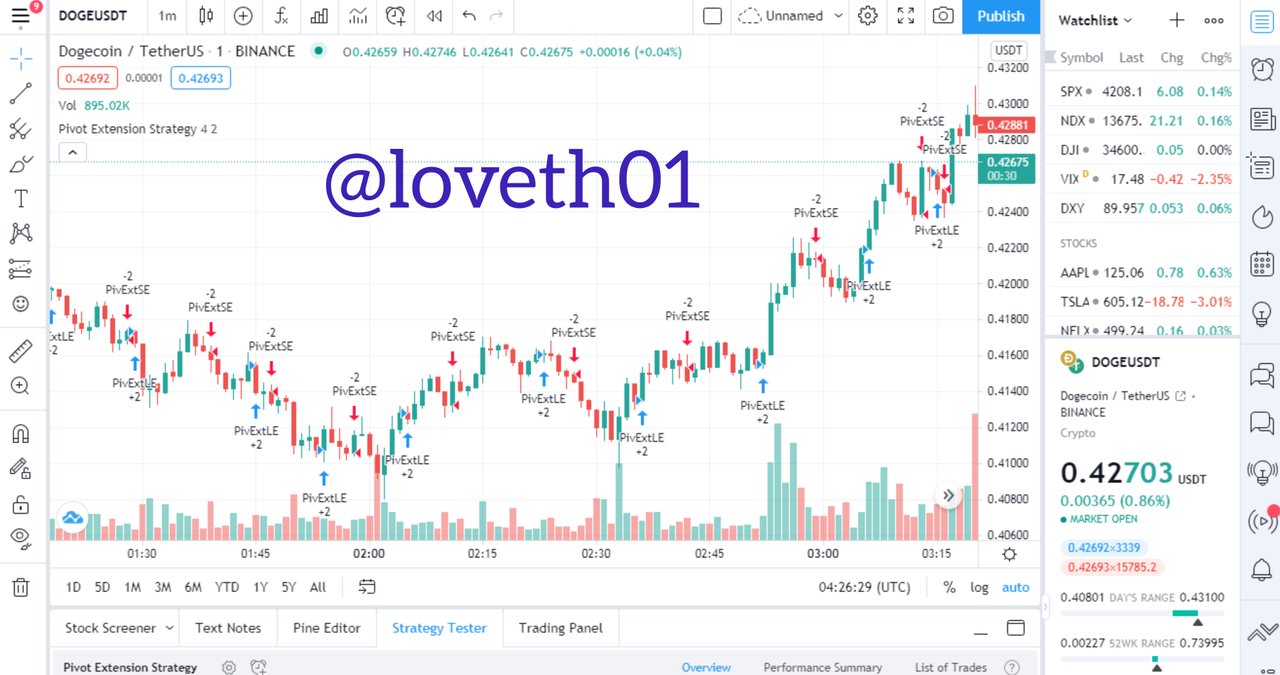
DOGE/USD ANALYSIS USING PIVOT POINT

From the Doge chart above, it can be seen that the pivot point was $0.4217000 and the price hovered around that mean point, the trend should be bearish and it may break the first support signal. I predict a trend that won’t go below the earlier low, and a price slightly lower ($0.4000000) at the end of today.
MY REASON FOR PREDICTING DOGE/USD
Doge is so far fast rising to become one of the prominent coins, this coin is one that has the potential being a major player in the cryptocurrency space. Doge is an open source cryptocurrency that uses the block chain technology ; although it is not fully decentralized.
TECHNICAL ANALYSIS

Technical analysis of any coin is the use of data from a previous trade to try and predict the value of a coin. Trade informations, like volume , closing price , highs , lows, previous support and resistance signals are evaluated and the current or future price of the asset in question is predicted on those past market behavior.
In conclusion,
If you like using past market trend to judge when to buy and sell then pivot point knowledge will be very good and useful for you.
Thanks to professor @stream4u this is my homework post.
Hi @loveth01
Thank you for joining The Steemit Crypto Academy Courses and participated in the Homework Task.
Your Homework Task verification has been done by @Stream4u, hope you have enjoyed and learned something new.
Thank You.
@stream4u
Crypto Professors : Steemit Crypto Academy
#affable
All the best dear thanks for sharing.
Thank you.