Crypto Academy Week 14 | homework post for @kouba | MACD indicator | by @loveth01.
Introduction,
In cryptocurrency trading, it is important that traders be able to predict the behavior or trends of the particular market they intend to put their money into. Technical analysis is the kind of analysis that uses the historical data of the market performance of an asset to predict its future behavior and this is done by the use of some special indicators. Indicators are tools available on cryptocurrency exchanges which tries to summarize the historical behaviors of that coin and use the information that has been analysed to forecast the market behavior based on those past data. Examples of indicators are RSI, MACD , etc.
WHAT IS THE MACD INDICATOR?
MACD is an acronym for "moving average convergence divergence " and it is made up of two lines, the MACD line and the signal line, and it displays a histogram either below ( bearish trend) or above (bullish trend), the zero line.Though it is an oscillator, it is not classically used to recognize over bought or oversold conditions. It is shown on the chart as two lines which oscillates without limits. The verge of the two lines gives trading signs comparable to a two moving equal system.
THE WORKING PROCESS OF THE INDICATOR
Intersection above zero is considered hulking, while crossing below zero is bearish. Secondly, when MACD goes up from below zero it is considered hulking. If it goes below after above zero it is considered bearish. When the MACD line passes from below to above the signal line, the indicator is said to be hulking. The more the line gets below zero the stronger the signal. Also if MACD line passes from above to beneath the signal line, indicator is known as bearish.
IS THE MACD INDICATOR GOOD FOR TRADING?
The inficator is a momentum indicator and it tells us how strong a bullish or bearish trend is or is going to be. This indicator is primarily built on the convergence and divergence of the MACD line and its signal line. So if a trader wants to verify how strong a bearish or bullish trend is going to be so as to sell for the best price or to know when best to sell to avoid great loses and to know the best time to buy more coins.
HOW TO ADD MACD AS AN INDICATOR
If you want to add the MACD as an indicator , below are steps you should follow;.
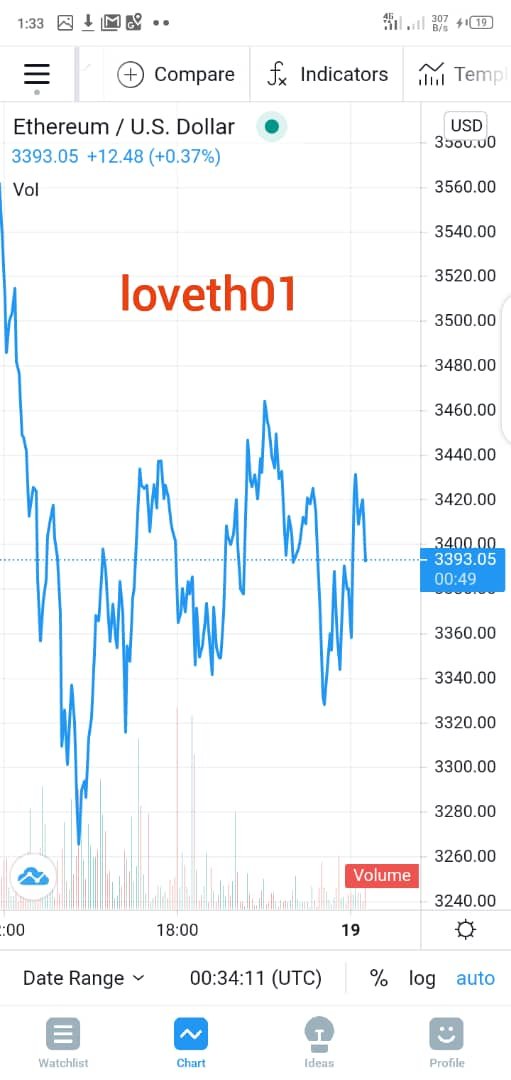
1 . Open the chart for the coin you want to add MACD as an indicator
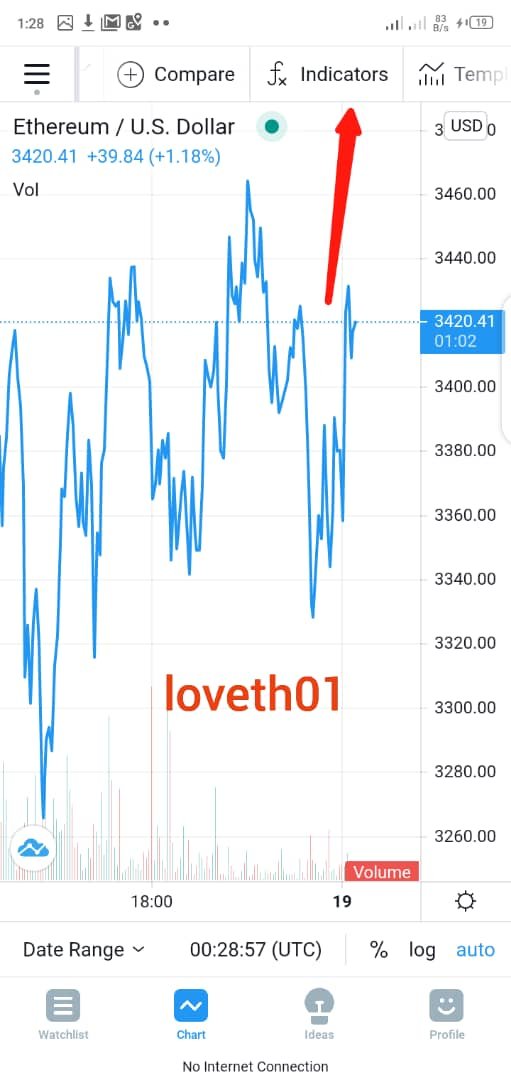
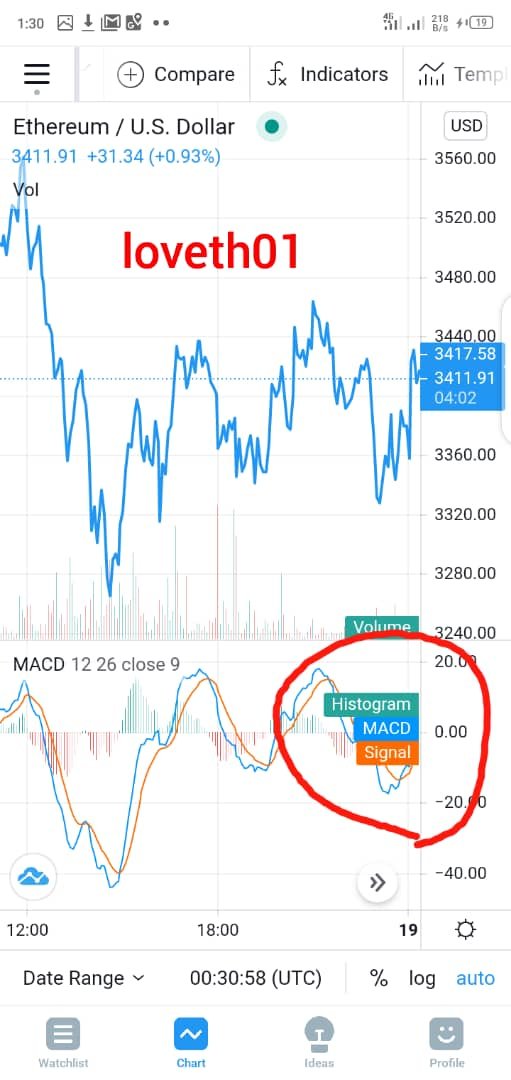
2 . Click on indicator at the top of your screen, then type MACD in the search bar provided, after typing select MACD to add the indicator
You might be wondering which one is better MACD OR RSI?
Both MACD and RSI measure the momentum of a cryptocurrency market and are good in trend determination but they read different factors. The RSI reads for overbought and oversold signals and how these factors affect the price of a cryptocurrency asset but the MACD reads for convergencies between the signal line ; an exponential moving average (EMA), and the MACD line ( another EMA) , and it uses these moving averages and a histogram to give more insight into the market. but if I am asked to choose one, I would go with the MACD indicator .
USING MACD WITH CROSSING MACD LINE AND SIGNAL LINE
With most crossover approaches, a buy signal comes when the shorter-term, more responsive line in the case of the MACD line crosses above the slower line the signal line. Equally, when the MACD line passes beneath the signal line it delivers a bearish sell signal.
As the crossover approach is lagging, it is based on coming up for a movement to happen before opening a position. The key problem faced by the MACD in feebler market trends, is that by the time a signal is made, the price may be getting to a reverse point. Then it will be called a false signal. It is means noting that approaches which exploit price action for the confirming of a signal are most times seen as more dependable.
HOW TO USE MACD WITH CROSSING OF ZERO LINE
Zero cross approach is centered on either of the EMAs passing the zero line. If the MACD passes the zero line from beneath, a different uptrend may be arising, while the MACD crossing from top is a signal that a different downtrend may start. This is frequently seen as the slowest signal of the three, so you will typically see lesser signals, but also less false reversals.
HOW TO USE THE MACD INDICATOR TO DETECT A TREND AND HOW TO FILTER OUT FALSE SIGNALS.
Whenever the MACD Line goes bellow the signal line twice; successively, and the later crossover is not bellow the first crossovers a point where the yellow line cuts the signal line) , it means that there is going to be bullish trend soonest. Also, when the MACD line makes two successive highs( when it cuts the signal line and goes above it) and the first high is greater than the second high, it indicates a bearish trend coming up soon.
False signals can be filtered using the support lines. So if a support line is drawn at both the bullish and bearish trends, any signals above the bullish support or mellow the bearish support is a false signal.
HOW CAN MACD INDICATOR USED TO EXTRACT POINTS AND SUPPORT FROM A CHART
The plan is to buy or close a little position when the MACD passes beyond the zero line, and sell or close an extended position when the MACD passes beneath the zero line.
This approach should be cautiously used, as the late nature means that fast, choppy markets mostly see the signals delivered late. Though, as a means for providing reversal signals of long sweeping moves, this can be very handy. If you use zero cross strategy, it is crucial to know where to exit the market, or place a stop.
CHART REVIEW OF ETH/USD
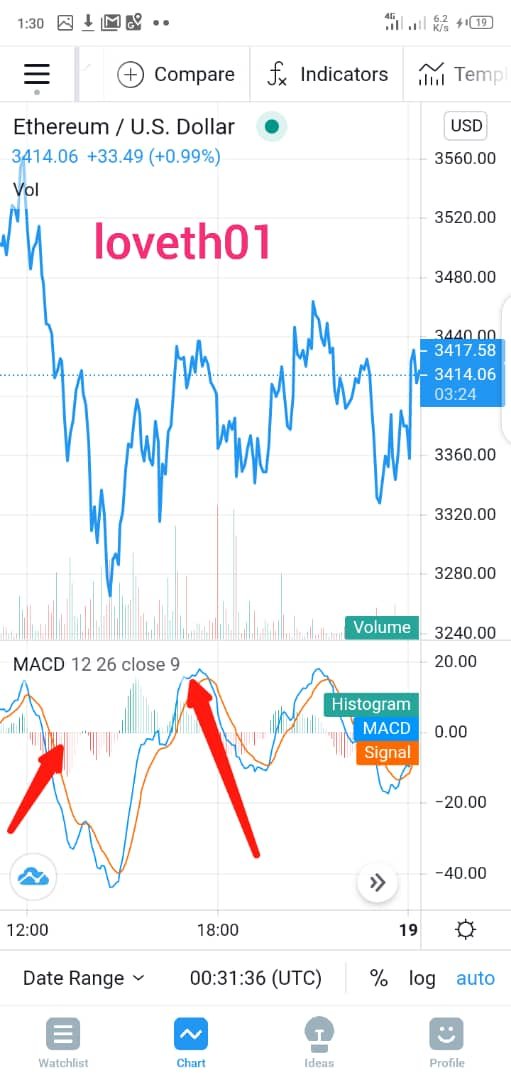
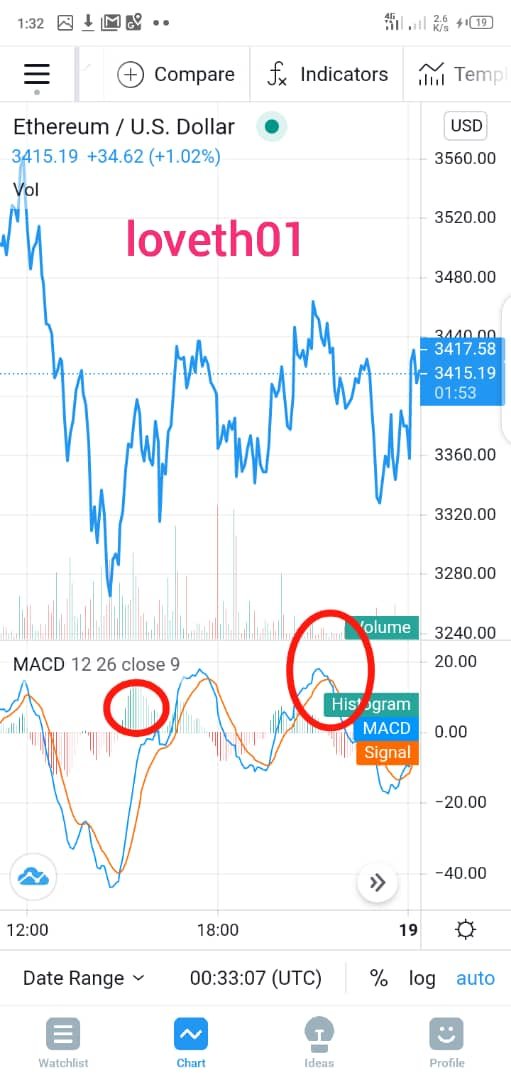
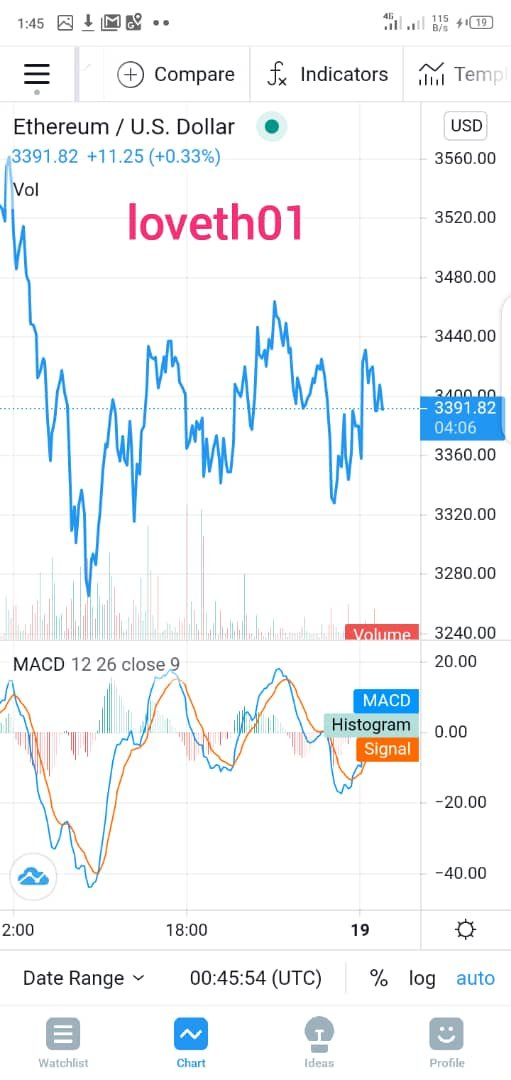
A careful observation of the successive peaks of the MACD line above the point of crossover ; from a higher to a lower high, was dollowed by a bearish trend as indicated in my above explanation, and from the histogram in can be seen that the bearish momentum is quite high. So if I were holding this coin, i won't panic, all I will do is to wait for a second downward crossover and a bullish trend will follow.
In conclusion,
The MACD is very easy to understand if you devote your time to it. you can study both RSI and MACD and decide which one you want to use.
Thanks to professor @kouba this is my homework post.
.jpeg)

Unfortunately @loveth01, your article contains plagiarized/Spun content
Rating 0/10
Source-https://www.fidelity.com/learning-center/trading-investing/technical-analysis/technical-indicator-guide/macd
The Steemit Crypto Academy community does not allow these practices. On the contrary, our goal is to encourage you to publish writing based on your own experience (or as per the mission requirements). Any spam/plagiarism/spun action reduces PoB's idea of rewarding good content.
Thank you.
Cc: -@endingplagiarism @sapwood
Am sorry professor, it was not intentional the mistake might have occurred when I was doing research online concerning the homework. Once again am sorry.
This content appears to be plagiarised as indicated by @kouba01.
If you have not already done so, you should head to the newcomers community and complete the newcomer achievement programme. Not only will you earn money through upvotes, you will learn about content etiquette;
You are currently in Stage 1 of our 4 Stage Process:
👉 Stage 1 - 1st Warning - Pointing offenders towards Achievement 3 and highlighting this process. All plagiarised posts currently pending rewards will be flagged and downvoted to $0 rewards.
Stage 2 - A Final Warning - Another request to stop and that plagiarism will not be tolerated. Downvotes amounting to 20% of total pending rewards according to steemworld.
Stage 3 - A stronger message - Downvotes amounting to 50% of pending rewards.
Stage 4 - The strongest message possible - Downvotes amounting to 100% of pending rewards.
Plagiarists will bypass stage 1 if translated from another language.
Notification to community administrators and moderators:
@steemcurator01 ADMIN
@steemcurator02 MOD