Steemit Crypto Academy Week 5 || SuperTrend Indicator

Hello Steemian...
Today I am going to write a Homework task made by professor @stream4u.
What is SuperTrend Indicator?
The supertrend indicator is one of the tools traders use to analyze volatile market movements. With the SuperTrend Indicator, it makes it easier for traders to open Sell and Buy positions just by looking at the colour change on the supertrend indicator chart, if the colour changes from red to green then you can determine to Buy position and if the color changes from green to red then the supertrend chart indicator will show you a position to sell.
How to setup SuperTrend Indicator on Chart
To start with the setup, the first thing you do is visit the site Tradingviews.com Then select ''Chart'' and select the type of crypto trading you want to analyze

then select on the ''public library ''

then enter the keyword '' Supertrend '' in the search field and select the supertrend indicator then the screen on your chart chart shows supertrend

Buy and Sell signals and how to trade.
now I will discuss how to analyze signals to buy and sell on this supertrend indicator. by looking at this supertrend indicator traders can easily analyze to buy on trades. as in the screenshot image below the green line below on the chart acts as a support level this identifies the trader to make a purchase.

Likewise in Sell, analyzing signals using this supertrend indicator traders can easily analyze to SELL. The red line shows the resistance line when the market is in a Downtrend, with supertrend indicators like my screenshot below traders can easily determine Sell positions .

False Indications.
This supertrend indicator is indeed good for identifying market movements. but this indicator will not always work, sometimes we will find some False Indications that make our profits not maximal. Like my screenshot below you can see how False Indications occur in the supertrend indicator. in circumstances like this it is highly recommended for traders to be patient and not panic in selling because the downtrend indicator only occurs for a few moments.

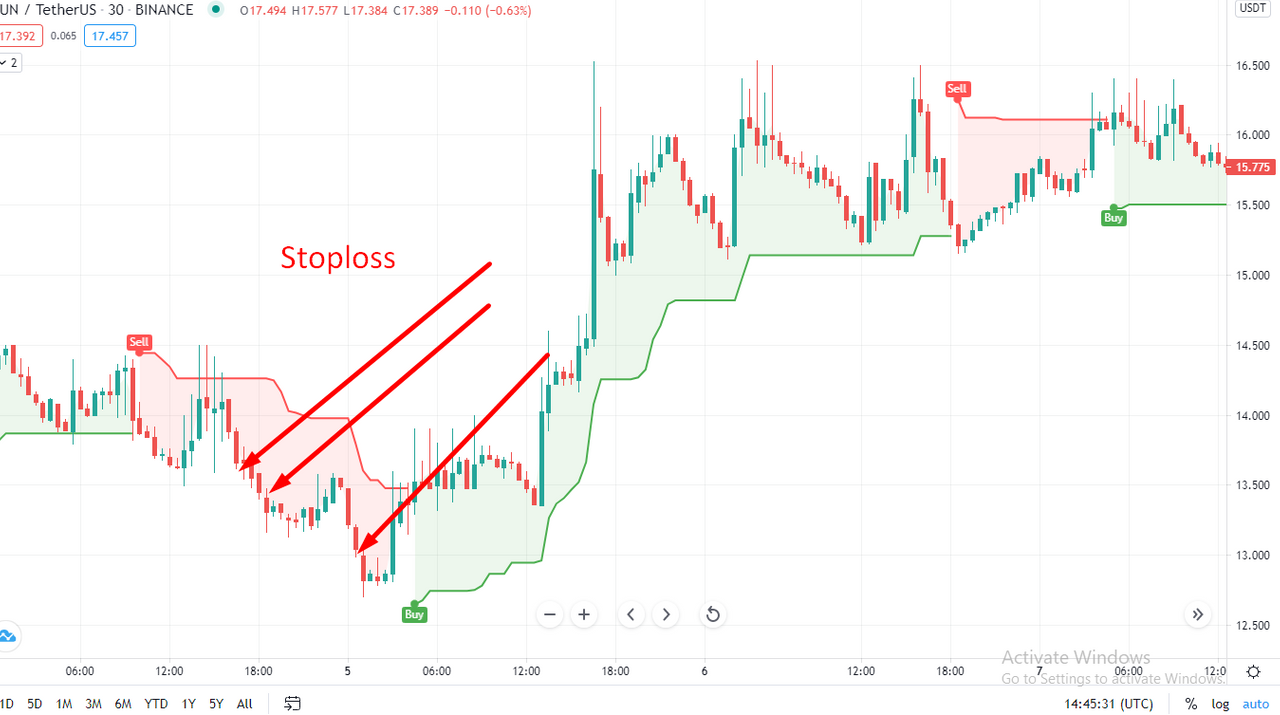
Stoploss.
Stop losses are really needed so that traders don't experience big losses in trading. If a downtrend occurs since you opened a Buy position, you must be ready to do Stop losses by looking at the support and resistance level indicators and selling at the lowest price.
Conclusion
By using the SuperTrend Indicator, it can make it easier for us to analyze the market to get a more accurate Buy and Sell position. The SuperTrend Indicator is also very easy to use and widely used by traders to get accurate signals in trading. Even though using the SuperTrend Indicator we can get strong signals, it is important to still setup a stop loss position to avoid big losses if a downtrend occurs.
Bahasa Indonesia
What is SuperTrend Indicator?
Indikator supertrend merupakan salah satu alat yang di gunakan para trader untuk menganalisa pergerakan pasar pasar yang fluktuatif.dengan SuperTrend Indicator mempermudah trader untuk membuka posisi Sell dan Buy hanya dengan melihat perubahan warna pada chart indikator supertrend ,jika warna berubah dari merah ke hijau maka anda dpat menentukan posisi Buy dan jika warna berubah dari hijau menjadi merah maka pada indikator chart supertrend akan menunjukkan anda posisi untuk melakukan Sell.
How to setup SuperTrend Indicator on Chart
untuk memulai melakukan setup hal yang pertama anda lakukan ialah anda harus kunjungi situs Tradingviews.com kemudia pilih ''Chart" dan pilih jenis perdagangan crypto yang ingin anda analisa
kemudian pilih pada bagian ''public Library''
kemudian masukkan keyword ''Supertrend' pada kolom pencarian dan pilih indikator supertrend kemudian layar pada chart grafik anda kan menunjukkan supertrend
Buy and Sell signals and how to trade.
sekarang saya akan membahasa bagaimana menganalisis sinyal untuk melakukan jual beli pada idikator supertrend ini.dengan melihat indikator supertrend ini para pedagang dapat dengan mudah menganalisa untuk melakukan beli pada perdagangan.seperti gambar screenshoot dibawah ini garis bewarna hijau di bawah pada grafik yang bertindak sebagai level support ini mengindentifikasikan kepada trader untuk melakukan pembelian.
Begitupun dalam Sell , menganalisi signal dengan menggunakan indikator supertrend ini para pedagang dapat dengan mudah menganalisis untuk melakukan SELL.Garis merah menunjukkan garis resistan ketika pasar dalam keadaan Downtrend ,dengan indikator supertrend seperti screenshoot saya di bawah ini para trader dpat dengan mudah untuk menentukan posisi Sell.
False Indications.
indikator supertrend ini memang bagus untuk mengindentifikasi pergerakan pasar.akan tetapi tidak selamanya indikator ini akan berhasil ,terkadang kita akan menemukan beberapa False Indications yang membuat profit kita tidak maksimal.seperti scrennshoot saya di bawah ini anda dapat melihat bagaimana False Indications terjadi dalam indikator supertrend.dalam keadaan seperti ini sangat disarankan untuk para trader untuk sabar dan tidak panik dalam melakukan sell karena indikator downtrend terjadi hanya beberapa saat saja.
Stoploss.
Stoploss sangat di perlukan agar para trader tidak mengalami kerugian yang besar dalam melakukan perdagangan,Jika terjadi downtrend semenjak anda memebuka pada posisi Buy anda harus siap melakukan Stoploss dengan melihat pada indikator level support dan resistance dan melakukan Sell pada harga harga terendah.
Conclusion
Dengan menggunakan SuperTrend Indicator ini dapat memudahkan kita dalam menganalisa pasar untuk memperoleh posisi Buy dan Sell yang lebih akurat. SuperTrend Indicator juga sangat mudah di gunakan dan banyak di pakai oleh para trader untuk memperoleh sinyal yang akurat dalam perdagangan.walaupun menggunakan SuperTrend Indicator kita bisa mendapatkan sinyal yang kuat ,penting untuk tetap melakukan setup pada posisi stoploss untuk menghindari kerugian besar jika downtrend terjadi .
Jangan Lupa Bahagia

Hi @levycore
Thank you for joining Steemit Crypto Academy and participated in the Homework Task 5.
Add #cryptoacademy in first 3 tags.
Your Homework task 5 verification has been done by @Stream4u.
Thank You.
@stream4u
Crypto Professors : Steemit Crypto Academy
Thank you for giving a good correction prof @stream4u . i will do as you say in my next post :D