Steemit Crypto Academy Week 3 ||Homework
Today I am going to write a Homework article made by professor @stream4u. What is Chart Patterns? | Price Breakout - Continuation Patterns - Reversal Patterns | STOPLOSS
What is a Chart Pattern
This patter chart is a technical part that we must use as cryptocurrency traders to be able to analyze the market so that our results can be more detailed and more accurate. why is this patter chart quite influential in technical analysis in trading cryptocurrency? Because this char pattern often repeats itself in traders, even though sometimes there is a slight difference, however, the substance remains the same, which provides a reasonably accurate signal.
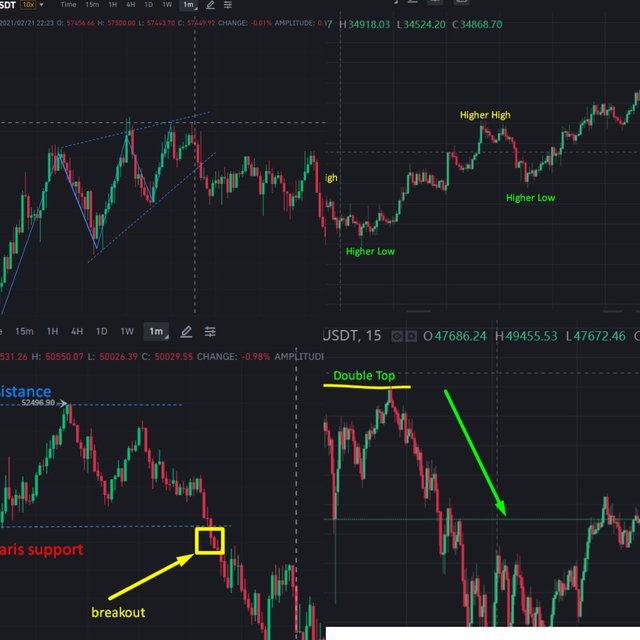
From my Screenshot image above you can see that in this cryptocurrency trading chart you can see various forms of chart patterns. By analyzing and studying the movement of this chart pattern, we can determine when to sell and when to buy so that we can manage the losses or profits that we will get in trading.
What Is A Price Breakout?
A breakout is a pattern on the chart when the price moves out of a resistance line or level or the price moves out beyond a support line or level.
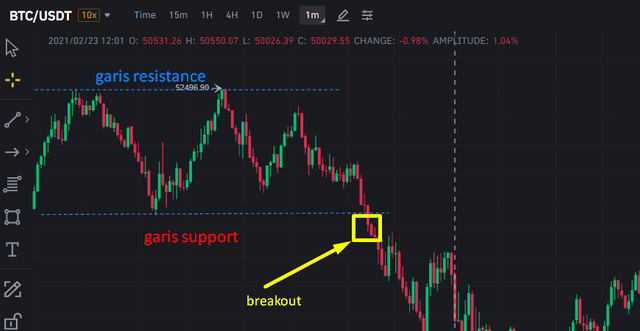
The price movement on the BTC / USDT trading chart is like in my screenshot. The price of BTC at the support level is 52496 USDT and the BTC price at the resistance level is 51182 Usdt. Then the chart shows that the price has dropped through the line or support level. as you can see in the picture above the function of this breakout itself is to find the selling price so that we avoid the losses caused by the price drop. Likewise for when prices redeem the resistance line or level we can find the initial price to buy and trade.
What is a Continuation pattern
A continuation pattern is a continuous pattern in a trading chart that gives us an indication that the price will continue to move according to the previous trend. If this Continuation pattern appears on the chart when the price is rising, then after this pattern is confirmed, the price will tend to move upward to continue the trend. and if this pattern appears on the chart when the price is down, then the price will tend to go down to continue the trend.
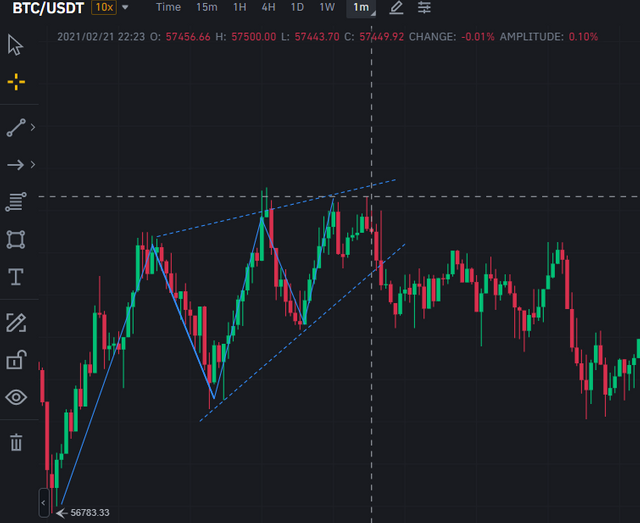
The screenshot image above is an example of a Continuation pattern where the pattern forms a repeating and continuous graphic. The price opened at 56783USD then the price moved up at 57200 in the price movement, we can observe a repeating pattern from the Continuation pattern. from here we can take advantage of buying and selling according to the pattern itself.
Higher High dan Higher Low
The Higher High and Higher Low patterns are used to analyze the highest and lowest price movements on a trading chart, making it easier for traders to determine prices.
Higher High is the highest price position from the previous high price on the trading chart while Higher Low means the lowest price position from the previous low price.
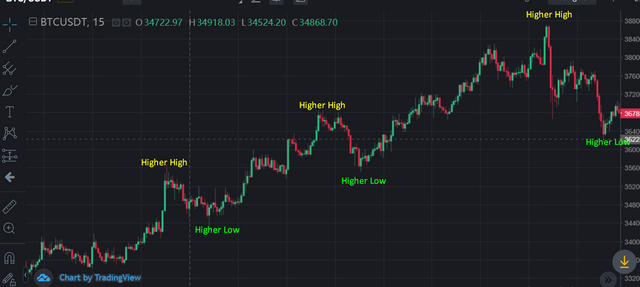
by looking at the chart screenshot above we can determine the lowest and highest prices on a trade. You can also choose from various types of time frames to see this Higher High and Higher Low.
What is a Reversal Pattern
A reversal pattern is a chart pattern that is used to signal a reversal of the direction of a chart pattern in the next trade.
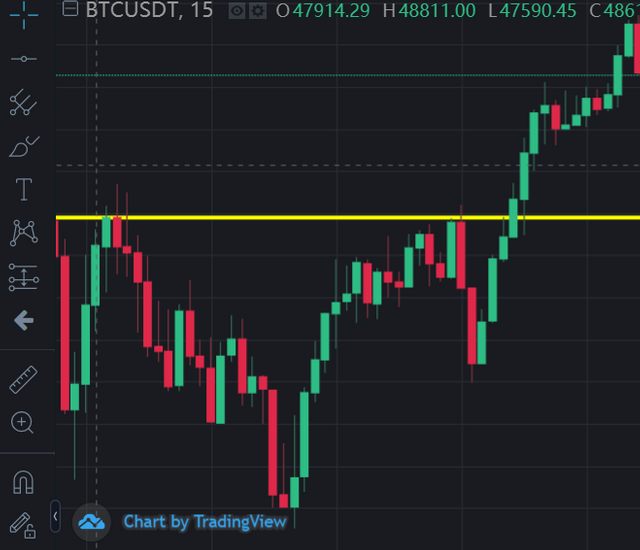
if this pattern appears when there is a price decline on the chart, then the price will start to increase.
Double Top
The double top is a chart pattern that indicates a decline in price when the chart forms a twin pattern at the highest price on the trading chart.
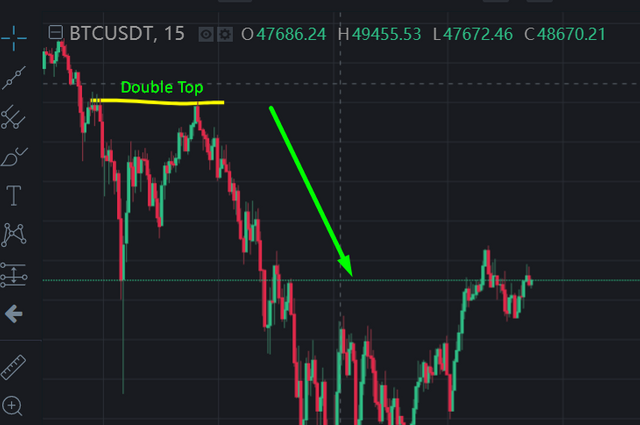
As in the screenshot above, it can be seen that when a double top pattern has been formed, the price will then jump down. It is highly hoped that traders see this pattern to immediately cut losses so that losses can be minimized.
Double Bottom
The double top is a chart pattern that indicates an increase in price when the chart forms a twin pattern at the lowest price on the trading chart.
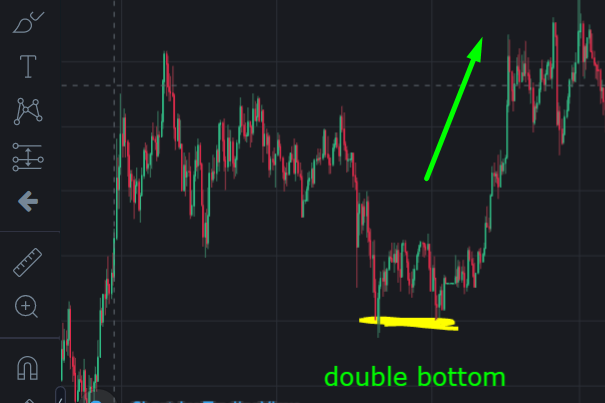
As in the screenshot above, it can be seen that when a double bottom pattern has been formed on the chart, the price will then jump up. buying is highly recommended when we see this pattern where we can maximize profits by buying at the lowest price.
Stop Loss
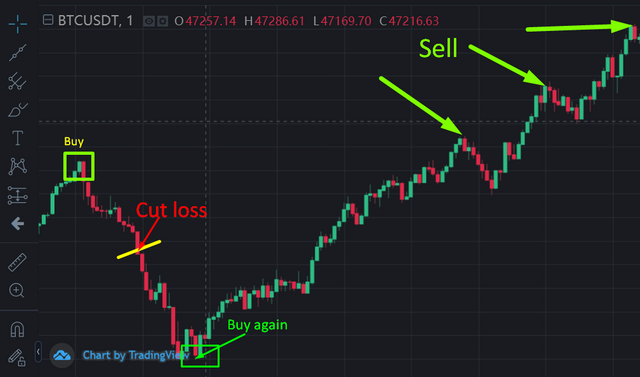
To minimize losses due to the drastic price drop that occurs in trading, it is highly recommended to cut losses when the price of the crypto asset you buy is in a very significant price decline. again crypto assets when the price has set the base price. Then you just have to wait until the price of your asset rises then determine at what price you want to sell the asset.
Conclusion
In the world of trading it is not intuition, filing and luck that are needed to get profit. It takes very careful planning in analyzing every form of market movement. This Fresh Pattern is a tool for professional traders to perform analysis. As novice traders we should learn to understand funds about the shape of the patterns on the trading chart so that we can get maximum profit.
#Bahasa Indonesia
Apa itu Chart Pattern
Chart patter ini adalah bagian tecnikal yang harus kita gunakan sebagai trader cryptocurrency untuk bisa menganalisa market agar hasil yang kita dapat bisa lebih detail dan lebih akurat. kenapa chart patter ini cukup berpengaruh dalam analisa teknikal dalam melakukan trading cryptocurrency? karena char pattern ini sering terulang kembali pada perdagang , walupun terkadang ada sedikit perbedaan namu demikian secara substansinya tetap sama yaitu memberika sinyal yang cukup akurat.

Dari gambar Screenshott saya di atas ini anda bisa melihat bahwasanya dalam grafik perdanganan cryptocurrency ini anda bisa melihat berbagai macam bentuk pola chart pattern . dengan menganalisa dan mempelajari pergerakan chart pattern ini kita bisa menentukan kapan harus menjual dan kapan harus membeli sehingga memanage kerugian ataupun keuntungan yang akan kita dapat dalam melakukan trading.
What Is A Price Breakout?
Breakout adalah pola pada grafik ketika harga bergerak keluar dari garis atau level resistance atau harga bergerak keluar melewati garis atau level support.

Pergerakan harga pada grafik perdagangan Btc/usdt seperti pada gambar screenshot saya ini .harga BTC pada level support ialah 52496 USDT dan harga BTC pada level resistance ialah 51182 Usdt .kemudian grafik menunjukkan bahwa harga telah turun menembus garis atau level support. seperti yang anda lihat pada gambar di atas fungsi dari breakout ini sendiri adalah untuk menemukan harga jual agar kita terhindar dari kerugiaan yang di sebabkan penurunan harga.begitu pula untuk ketika harga menebus garis atau level resistance kita bisa menemukan harga awal untuk melakukan membeli dan melakukan trading.
Apa itu Continuation pattern
Continuation pattern merupakan pola berkelanjutan dalam grafik trading yang memberikan kita indikasi bahwa harga akan bergerak meneruskan pergerakan sesuai dengan tren sebelumnya.
Jika pola Continuation pattern ini muncul di grafik pada saat harga sedang naik maka setelah pola ini terkonfirmasi maka harga cenderung akan bergerak naik meneruskan tren tersebut.
dan jika pola ini muncul di grafik pada saat harga sedang turun, maka harga pun akan cenderung akan turun meneruskan tren tadi.

Gambar screenshot diatas ini adalah salah satu contoh pola dari Continuation pattern dimana pola membentuk grafik yang berulang dan berkelanjutan. Harga dibuka pada 56783Usdt kemudian harga bergerak naik pada harga 57200 pada pergerakan harga kita bisa mangamati pola berulang dari Continuation pattern. dari sini kita bisa mengambil keuntungan melakukan jual beli sesuai pola itu sendiri.
Higher High dan Higher Low
Pola pattern Higher High dan Higher Low adalah untuk menganalisa pergerakan harga tertinggi dan pergerakan harga terendah pada suatu grafik trading sehingga memudahkan para trader untuk menentukan harga.
Higher High adalah posisi harga tertinggi dari harga tinggi sebelumnya pada grafik trading sementara Higher Low artinya posisi harga terendah dari harga rendah sebelumnya.

dengan melihat screnshot grafik di atas kita bisa menentukan harga terendah dan tertinggi pada sebuah perdagangan anda juga bisa memilih dengan berbagai jenis Time frame untuk melihat Higher High dan Higher Low ini.
Apa itu Reversal Pattern
Reversal pattern merupakan chart pattren yang digunakan untuk mengisyaratkan akan adanya pembalikan arah dari sebuah pola grafik pada perdagangan selanjutnya.

jika pola ini muncul ketika sedang terjadi penurunan harga pada grafik maka selanjutnya harga akan mulai terjadi kenaikan.
Double Top
Double top merupakan pola chart pattern yang menandakan akan terjadi penurunan pada harga ketika grafik membentuk pola kembar pada harga tertinggi pada grafik perdagangan.

Seperti pada screenshoot di atas terlihat bahwa ketika telah terbentuk pola double Top maka harga kemudian akan melonjak turun.sangat di harapkan bagi para trader jika melihat pola ini agar langsung melakukan cutloss sehingga kerugian bisa di minimalisir.
Double Bottom
Double top merupakan pola chart pattern yang menandakan akan terjadi kenaikan pada harga ketika grafik membentuk pola kembar pada harga terendah pada grafik perdagangan.

Seperti pada screenshoot di atas terlihat bahwa ketika telah terbentuk pola double Bottom pada grafik maka harga kemudian akan melonjak naik. pembelian sangat disarankan ketika kita melihat pola ini dimana kita bisa memaksimalkan keuntungan dengan membeli pada harga terendah.
Stop Loss

Untuk meminimalisir kerugian karena penurunan harga drastis yang teradi dalam perdagangan sangat disarankan untuk melakukan cut loss ketika harga aset crypto yang anda beli sedang dalam penurunan harga yang sangat signifikan .seperti screenchot saya diatas ketika terjadi penurunan akan lebih bagik jika kita langsung melakukan cutloss dan membeli kembali lagi aset crypto ketika hargasudah menyetuh harga dasar.kemudian anda tinggal menunggu sampai harga aset anda naik kemudia tentukan di harga berapa anda ingin menjual aset.
Kesimpulan
Dalam dunia Trading bukanlah intuisi,filing dan keberuntungan saja yang di perlukan untuk mendapatkan profit.Butuh perencanaan yang sangat matang dalam menganalisa setiap bentuk pergerakan pasar.Chart Pattern ini merupakan alat bagi para trader profesional untuk melakukan analisis.sebagai trader pemula kita harusnya belajar dana memahami tentang bentuk pola-pola yang ada pada grafik perdagangan supaya kita bisa mendapatkan profit yang maksimal .
All of these screenshots I took on the Binance exchange market
Jangan Lupa Bahagia

Hi @levycore
Thank you for joining Steemit Crypto Academy and participating in the Homework Task 3.
Your Homework task 3 verification has been done by @Stream4u. Please add the exclusive tags #cryptopattern, #stream4u-week3 in the first 2 tags.
Thank You.
@stream4u
Crypto Professors : Steemit Crypto Academy
Thank you prof @stream4u, I really appreciated it :D
Please add the exclusive tags #cryptopattern, #stream4u-week3 in the first 2 tags. Post is under review.
Mantap sekali ilmunya, Bang. Supaya gak salah menganalisis harga lagi nih biar ga kena FOMO ehehe
iya @anggreklestari harus di pelajari pola-polanya agar tidak kena jebakan betmen :D
selamat malam bang.
Mantap bang jadi sedikit ngerti cara ngeliat candle stik.
hehehe iya fadli saya juga masih belajar . heheh :D
Bang kapan ni Main ke jawa barat lagi..?
Insya Allah , jika ad kesempatan pasti saya main2 kesana :D
aamiin, sy masih simpan poto2 abang sama kaka abang
hehe mantap fadli. :D
Thanks
По-моему у вас получилось выучить урок профессора и объяснить правильно и понятно другим участникам. Спасибо.
Thank you @vipnata, I really appreciated it :D