Steemit Crypto Academy | Homework Task 3 For @stream4u | What is Chart Patterns? | Price Breakout - Continuation Patterns - Reversal Patterns | STOPLOSS
Hi all, I am getting so much difficulty in understanding the Price chart but I don't stop learning those.
Crypto Academy giving a chance to learn more about it. I don't know I am learning correctly or not but in my post, I share what I learn from this today post. If any wring I give pls give guidance to me.
Because I am very new to chart learning, Now I found trading based in the news so I exit with 30-50% profit, but if I having a grip on price chart analysis is possible to improve my profits too. That's why I start learning Charts now.
Hope soon I get grip on the understanding price chart.
Still, I have one question in which time frame we need to check the price chart. Most of them suggest 4 hours, 1 day and sometimes 1-week chart also. Pls, clarify the time frame which we need to consider for our trade. And one more question is what is meaning buy low, mid and high cap coins too. I doubting that topic. Pls if possible explain those.
Now I try my best to finish my homework task 3 by @stream4u.
Question 1:-
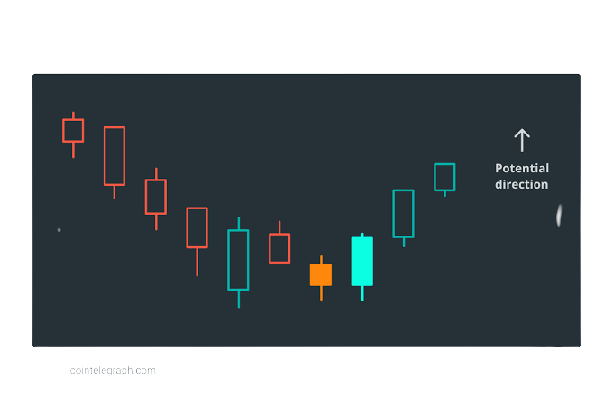
What Is A Chart Pattern? Explain with Candlestick Charts.
Chart Pattern means historical price changes of a particular coin in a particular time frame. Based on this we can predict it's a trend. On seeing the previous price change of a coin we can possible to predict it's upcoming direction. Most Traders follow this. And took their positions based on history. Some times our assumptions do not give positive results due to sudden market changes. But from this, we can get almost 90% positive results.
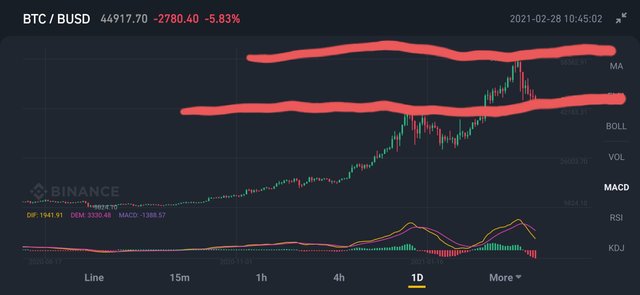
For Example, now here I took the current BTC/BUSD 1 day chart.
On seeing this chart, I think BTC may go 44k range than after again it may go uptrend towards 58k I think. Here I think BTC having 44k support. After reaching it may go upward or downward too. In this situation, we need to wait until confirming it's a trend. Then after we need to take our positions.
Question 2:-
What Is A Price Breakout? Explain with Candlestick Charts and mention the price levels.
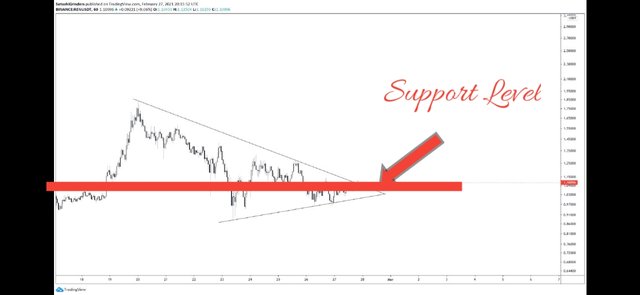
If coin price cross it's resistance level or support level is known as Price Breakout.
After breakout price, 90% of coins go upwards direction but there is a 10% chance to go downtrend again.
For Example, here I took REN/USDT chart. As per my analysis, I think around 1.01$ is the REN support level, if it breaks then we see a huge pump in the upcoming days. Based on this I took my positions.
Question 3:-
What Is A Continuation Pattern? Explain with Candlestick Charts and mention the price levels.
A continuous pattern price chart gives the correct direction of a coin. Based on this we can analyse its price move. Here we have two chances one is going upwards direction continuously or found down continuously.
Base on this we can decide our entry and exit.
For Example, Here I taking BTC/BUSD weekly chart. From starting December 14th to January 5th BTC gets continuous go the upward direction. Just check my below chart.
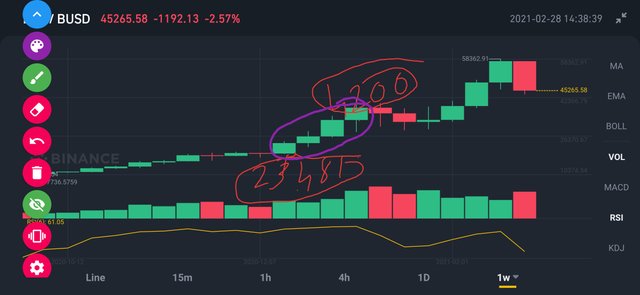
Its pump starts from 23481 sats to around 4200 sats, huge pump we see, then after it took correction again go upward direction now taking correction.
Question Number 4:-
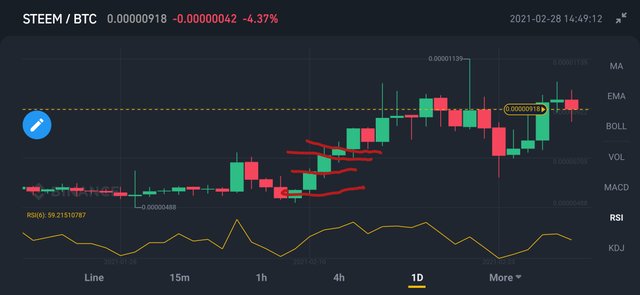
What Is A Higher High Formation? (Explain with one of the crypto coin charts where the Higher High Formation identified.)
In this situation, we see the complete upward direction of a coin. Here coin price go higher to higher.
For Example, here I taking STEEM/BTC 1day chart previous history. On seeing this we can last month it goes continues higher to higher direction up to 4 days. Then after again it dumps.
Question Number 5:-
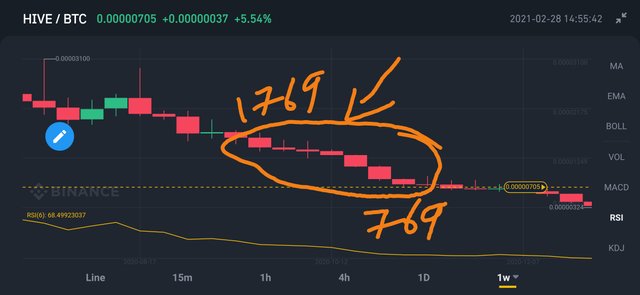
What Is A Lower Low Formation? (Explain with one of the crypto coin charts where the Double Top Pattern identified.)
In this situation we see continues dump of a time in a certain period. Then after it gets a massive pump.
For Example, here I took the HIVE/BTC weekly chart. It gets a huge dump in December. Continuous throughout the month it gets a huge dump from 1769 sats to 769 sats. In this situation HIVE coun price going lower to lower not getting any support.
Question Number 6:-
What Is A Reversal Pattern
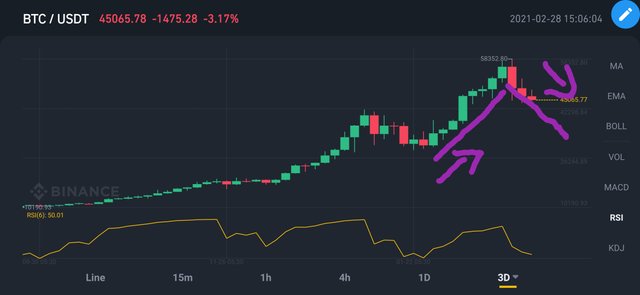
If the trend stop and taking its opposite direction is known as a reversal pattern. I see this trend this time in BTC.
From last 2 to 3 months BTC pump huge now from last 3 to 4 days we seeing it's down word direction. Here we can except now BTC taking rest giving opportunity for Alts.
For Example, here I taking BTC/USDT 3 day chart. On seeing this we can see that now it starts its reversal trend.
Question 7:-
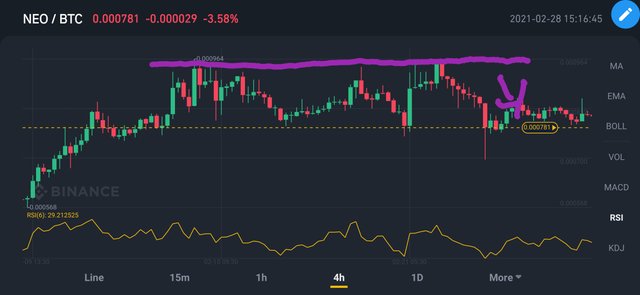
What Is A Double Top Pattern? Explain with one of the crypto coin charts where the Double Top Pattern identified.
Double Top Means if any coin price touch two types at its top high previous register price is known as Double Top Price of a coin. Here that coin creates it's Double Top Pattern chart.
If any coin creates this then we see a major dump of coun. Because it reaches its overbought position so now investor starts to book their profit so we see a major dump of a coin.
For Example, here I taking NEO/BTC chart. On seeing this chart we can understand that it reach TWO TIMES its double Top price of 964 sats, then after it gets a huge dump.
Question 8:-
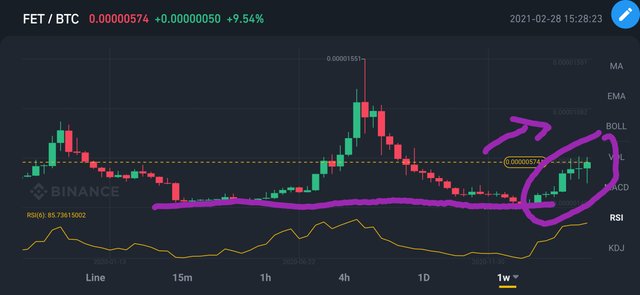
What Is A Double Bottom Pattern? (Explain with one of the crypto coin charts where the Double Bottom Pattern identified.)
If any coin price touch it's the lower price level in Two types, here we get Double Bottom price, it's chart pattern known as Double Bottom Pattern.
In this situation, we see a huge pump soon because the selling of that coin get Ends so investors start investing in that coin.
For Example, here I taking FET/USDT 1week chart. On seeing it's the chart we can see that it touch it's double bottom level Two times, so now we see it's may soon go the upward direction.
Question 9:-
In Investing & Trading What Is The Importance of Stop Level
Stoploss play a big role in reducing our huge loss in the Market. Sometimes we see a sudden Market crash in that time our stop loss give avoided a huge loss to us.
Some people always hesitate to keep their stop loss in their trading. I am also one of that person, I always prefer to hold if any situation occurs but due to this we need to miss huge opportunities on strucking that coin. It's better to keep to stop loss 10% below to our buying price always. If it dumps than there again we get a chance to buy that coun in more dip, here we can maximise our profit also. But need to bear a little bit of loss also.
Question 10:-
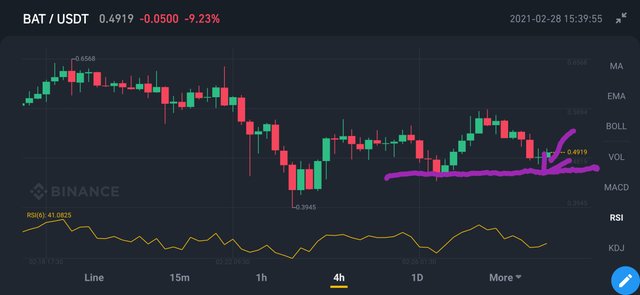
Where To Find & How To Set A Stoploss?
On checking the previous history of coin price we can to find our stop loss point where we put it.
Here possible to reduce huge loss and get possible to grab other sudden opportunities too. No need to waste our time also.
For Example, here I taking the BAT/USDT 4 Hours chart. On seeing this chart this its support level would be 0.45$, so wish to keep my stop loss around 0.4$ is a good choice.
For the Short term, traders, Stop loss play a big role, for long term holders no need to feel about sudden pump because here we hold for the long term so no need to worry about seeing sudden dumps and pumps.
My Conclusion:-
Before I do trading without checking the previous price chart, then after I start my trading on seeing the chart. And try my best analysis of the trend of that coin.
In today lesson I learn the importance of stop loss and where we put our stop less. Along with Double Top and Double Bottom of coin price and many more.
Now I start learning price chart slowly but I know need more experience to understand those. But I try my best then after.
Thanks for giving this amazing lecture to us.
I complete my homework as per my understanding if any mistakes I do pls explain them to me.
Thanks for reading My Post.
Hi @lavanyalakshman
Thank you for joining Steemit Crypto Academy and participated in the Homework Task 3.
Your Homework task 3 verification has been done by @Stream4u.
Thank You.
@stream4u
Crypto Professors : Steemit Crypto Academy
Sure In upcoming post i use captions for my images. Thanks for verify my Home work.