Steemit Crypto Academy | Homework Task 4 For @stream4u | Support <----> Resistance | What is Technical Indicator? | Overview Of TradingView | 200 Moving Average.
Hello steemians,
Have a good start to the week, I wish you energetic days to finish all the homework offered by our dear professors. Personally, I'll start with Mr @streamu's homework in whichwe are going to deal with very interesting contexts in the world of trading, like Support <----> Resistance |Technical Indicator| TradingView | 200 Moving Average, so welcome and happy reading for all.


What Is The Meaning Of Support Can Become Resistance & Resistance Become Support?
If any support level is broken by a relatively large amount, this level turns into a resistance level, and vice versa, if any resistance level is broken by a relatively large amount, this level turns into a support level.
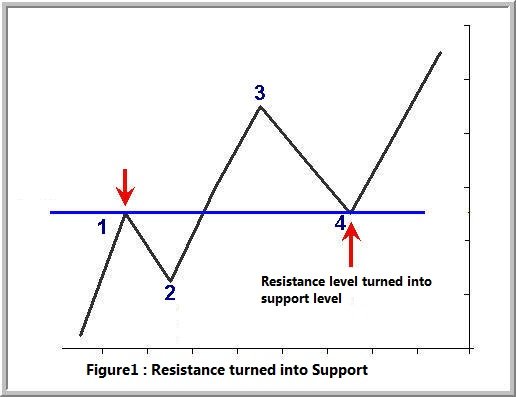
Looking at Figure 1, we notice that the prices are rising, and point 4, which was a previous resistance at point 1, and after the price broke it to the upside, this previous resistance became support, and all the sell-offs approaching the highest point in wave 1, which was the resistance level, have now become buying The lower the market approaches point 4, so this point becomes support.
 Figure 2 illustrates an example of the ETH /BTC pair, explaining how the resistance turned into a support level

Also, looking at Figure 3, we notice that the prices are declining, and point 4, which was a previous support at point 1, and after the price broke it to the downside, this previous support became resistance, and all the purchases approaching the lowest point in wave 1 (which formed the support level) turned into Now, selling is taking place whenever the market approaches point 4, thus this point becomes resistance.
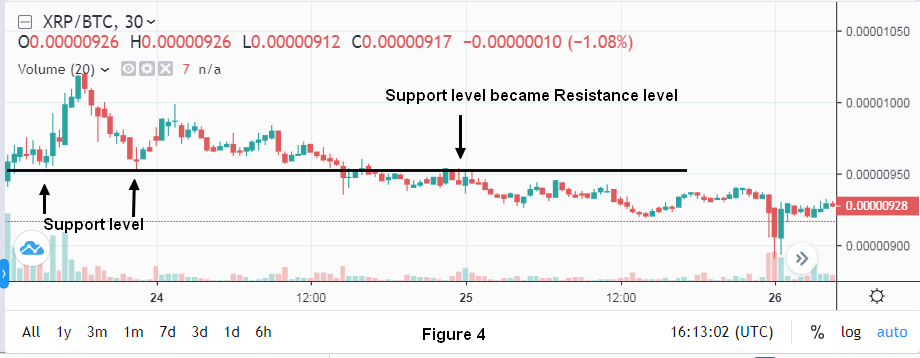
Figure 4 shows an example of the XRP / BTC pair, showing how the support level turned into resistance
When and Where set Buy trade ?
The best way to take advantage of support and resistance in the trading process is by executing purchases near support areas or parts of support ranges included in the chart, after which the markets expect the trend to turn up.
Support and resistance help to separate the long-term trend. Even when trading a specific range within the chart. In general, the trend specifies guidelines about the type (bullish or bearish). For example, if the trend is down and there is a development in the range (development in the range indicates that the price has crossed a support area), then making a sale at a resistance level is better than buying at a support level. The trend explained to us that in a downturn and the opportunity to make a profit will be Bigger if we sell. But if the trend is up, then it is better to buy near the support level.
Buying near a support can pay off, but there is no guarantee that the support will hold and hold. Therefore, you should think carefully about waiting for some assurances that the market still respects these areas.
If buying is close to support, wait for the consolidation in the support area, then buy when the price breaks above the small consolidation area. When the price moves in this way, it lets us know that the price is still respecting the support area and also that the price is starting to move above the support.
What is a technical indicator?
Technical indicators are miniature charts that are calculated by mathematical equations based on the data that the price movement gives us, and these indicators are used to follow price movements and help us in interpreting them and predicting the trends of their future movements, and they are considered tools that support the technical decision of the analyst.
Technical indicators are divided into three main types:
- Trend indicators that are used to identify and trade with a trend. These indicators succeed during a directional movement but fail when the market is sideways.
- Momentum indicators, which are used to measure the strength of the current price movement compared to previous periods to identify areas of trend reversal and combine them with directional indicators weighs them and increases the likelihood of success of the resulting trades.
- Volatility Indicators, which are used to determine the degree of price activity, and have a large role in generating signals and opportunities in the market, and some of them are used to determine the stop loss of deals
Example: The MACD trading indicator calculates the difference between two exponential moving averages and represents the positive and negative values on your chart.
The MACD indicator consists of two lines, one of which is called a signal line and the other is called a MACD line and a histogram, when the value of the histogram is positive (green as in the picture), this indicates that the trend is up, and if the value of the histogram is negative (red as in the picture) then This indicates that the trend is down.

Overview Of TradingView:
Tradingview is a service package. The site includes a dynamic graphical and technical analysis platform with all the ancillary services essential today, such as the management of plots, alerts, lists and your workspaces. This will give you increased optimization for your own use.
The 2nd facet of Tradingview is to claim to be a communication portal between the different traders / investors. You can therefore publish commented graphics directly on the platform and thus be able to exchange different points of view on the associated forums.
A multitude of products are available ranging from actions on an impressive number of markets, through currencies, FOREX or even cryptos.
This is the Tradingview.com home page when you first visit before you register.

To benefit from the free version, a simple registration will be necessary. This will allow you to save your tracks, put titles in a watchlist, and start to be able to customize your workspace.
This is the home page after registration.
- An upper part grouping the tabs to navigate in the different services as well as a search bar
- A central part bringing together a summary of the markets and a flow of ideas / news.
- A side panel on the right including your lists, alerts, calendars, forums and notifications.

Let's start with the heart of the Tradingview service: Its graphics platform
We will discuss the ergonomics of the platform, its general interface, the available tools and the associated services. We will also see that the free version has some limitations. They are not necessarily prohibitive for occasional use but will be felt as soon as you want to push its use further.
The graphics platform is accessible via the tab below, a dynamic graphic will then open in a new tab in your browser.

On the left you will find all the graphic tools necessary to carry out your plots.
The top panel remains attached to the operation of the displayed graph. It will allow you to manage the technical and financial indicators, the search bar and especially the displayed time unit.
The bottom panel manages the stock screeners, note taking, code editor, and truly trading oriented services. In our case we can use the note-taking editor as a logbook in addition to our trading log.
The side panel is a drawer space. We will detail some of its options that will be essential in your daily use of the platform.

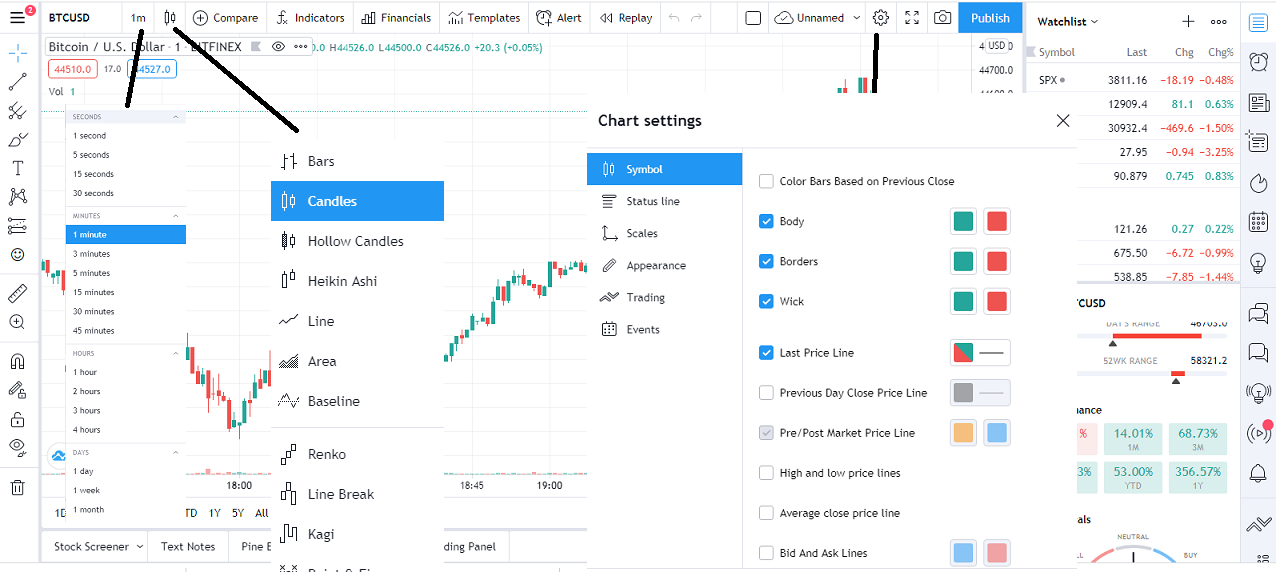
Before starting, let's correctly configure the graphical representation of the price that we have on our chart.
We will use a Japanese candlestick representation, the one on the screen. However, for greater clarity, I recommend putting the borders in black on the light theme.
Other representations are possible on the platform, in particular in hollow candles or in Bars.
For me the candlestick display is by far the most intuitive and offers a good level of information about the prices.
What is 200 Moving Average?
The 200 day moving average is a crucial measure of long-term trends. This is what you might call the "big picture" of how a particular market is performing.
This moving average will not tell you where to place a buy or sell order in a single day or on a daily trading basis, but it will inform you whether you need interest in a particular currency in order to buy or whether you should start thinking about exiting the market.

How and when we can trade/invest with the help of 200 Moving Average?
The 200 day moving average is often used as a trend finding tool, and is also known as a support or resistance level, especially on the daily chart. This is because it represents 200 working days throughout the year. If the 200 day moving average turns up, you are looking to buy the asset, and of course the opposite is true.

As we can see on the chart above, there has been a reaction to the 200 SMA on the daily chart more than once. However, I would like to point out that a moving average itself is not usually a reason to participate. Most of the time you have to research price action with that moving average to back up your trading decision.
My opinion on trading strategies using moving averages 200
I think the moving average trading strategies work very well over the long term. However, whether or not a trader is able to hold on to those trades is a completely different matter. You have to look inside yourself to see if you can handle a lower win percentage. Most traders cannot do this, which is why these systems get so little reputation. If you have a lot of patience, profitability has been around for several decades. This is why over time these systems have become essential for traders. The question is whether or not you can handle it.
Cc:-
@steemitblog
@steemcurator01
@steemcurator02
@stream4u
Hi @kouba01
Thank you for joining Steemit Crypto Academy and participating in the Homework Task 4.
Your Homework task 4 verification has been done by @Stream4u.
Thank You.
@stream4u
Crypto Professors : Steemit Crypto Academy
Twitter promotion