Steemcryptoacademy Week16, Home-work Post for [@kouba01]...Currency Trading With Bollinger Bands
INTRODUCTION
Greetings to you my lovely and compassionate friends. It is my pleasure to be a participant of this week Cryptoacademy lessons, most especially in the lesson of professor @kouba01 on the topic: Cryptocurrency Trading with Bollinger Bands. After studying his lesson I find it necessary to carried out my homework task. Cheers as you read through....
Define the Bollinger Bands indicator by explaining its calculation method, how does it work? and what is the best Bollinger Band setup?
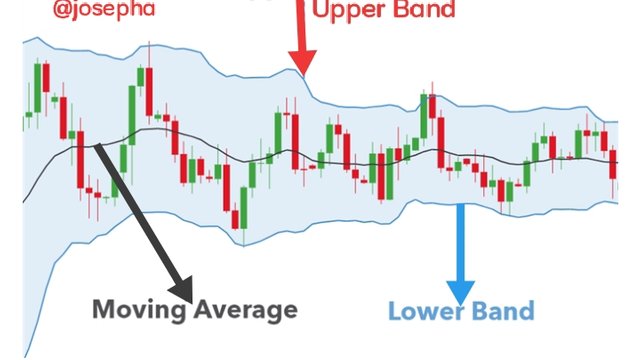
Bolling Bands can be defined as a technical analysis tools that consist of a trendlines involving two standard deviations known as the positive and the negative that is out of the average of a price, although the trendlines can be adjusted to suit users need. In another words. Bollinger Bands comprises of a line and two price channels (bands) that is above and below in it. The Bollinger Bands centerline is an exponential moving average where the price channels represents the standard deviations of the asset. The bands usually expand and contract whenever the price of an issue is getting Volatile (expansion) or getting bound into a tight trading pattern. In the year 1980s, John Bollinger, developed the technique of using a moving average with two different trading bands known as the above and below.
Bollinger Bands calculation method
In calculating Bollinger Bands is to first calculate the simple moving average (SMV) using a 20days simple moving average that bring out the closing price within the first 20days. After calculating for the first 20days SMA the next thing to calculate the data point that would be drop, if it drop in the earliest price, add the price on 21days and take the average continuously, before obtaining the standard deviation of the security price. The Bollinger Bands standard deviation is calculated by taking the square root of the variance, that is the square of the mean deviation. After calculating the square differences of the mean the next thing is to times (×) the standard deviation value by 2 before adding (+) and minus (-) the amount gotten from each of the point together with the simple moving average.
Below is the formula used in calculating Bollinger Bands;
BOLU = MA(TP,n) + m * σ[TP,n]
BOLD = MA(TP,n) - m * [TP,n]
Looking at the about formula where;
BOLU = Upper Bollinger Band
BOLD = Lower Bollinger Band
MA = Moving average
TP = Typical price (High+Low+Close)
σ[TP,n] = Standard Deviation at the last n period of Typical Price.
How Bollinger Band Work
The Bollinger Band work when price are overbought on the upper side, at the time they touch the upper hand and oversold on the downside when the price get to the lower band. As price keep on moving back and forth between the upper and lower indicators Bollinger Bands very good to measure volatility. When the bands have a less Volatility in the market, it means is a large indication to that need to make use of range bound strategy. Although, Bollinger Bands will keep on increasing as market keep becomes more Volatile.
What is the best Bollinger band setup,
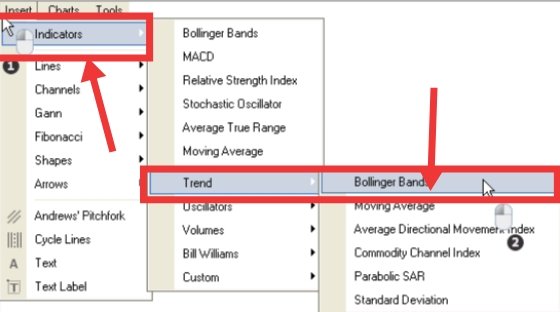
To me MetaTrader4 is the best Bollinger Band setup.
- On your MetaTrader4,Click on on insert and select Trend and Indicators.
- Click on Bollinger Bands
After you have completed the step above, the settings menu will appears known as the parameters as shown below on the screenshot.
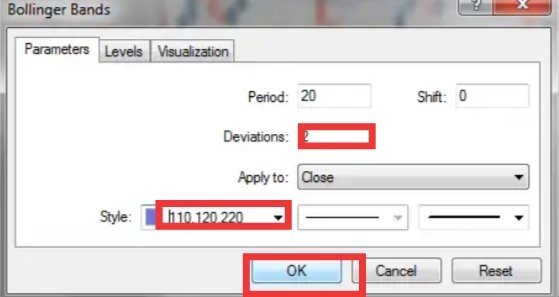
The parameters are of two types;
- Visuals of an indicator
- Calculations of the indicator
After you have successfully setup the Bollinger Band you can still delete the it by using the same step that is given above with a different of delete.If you must delete what you have setup you must be at the exact line of the indicator so the menu can be shown to you before deleting.
What is a breakout and how do you determine it? (Screenshot required)
Breakout simply means a situation where there is no direction of price movement. Breakout is actually not a trading sometimes traders think when price hit the bands is a signal showing that it's time to buy or sell when it is not so. In a nutshell Breakout is when the price of assets make a force turn either above or below the support and resistance level.
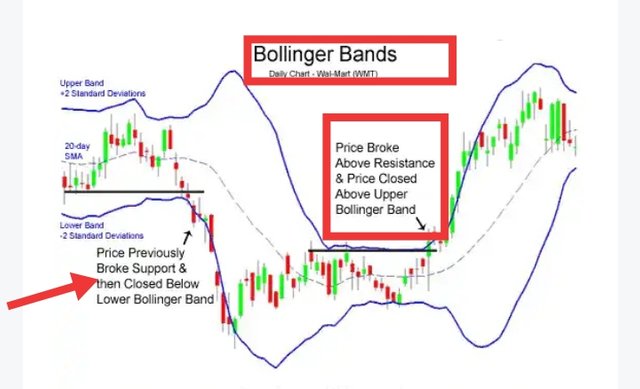
The above screenshot is Wal-Mart (WMT), breakouts showings to Bollinger Band.From the screenshot you can see that trader are ready to buy when price breaks above the upper Bollinger Band following the period of price consolidation. Whereas other confirming indicators may wish to make used of the trade, why waiting for resistance to be broken.
How do you determine it?
The first step in trading breakouts is to determine current price trend patterns along with support and resistance levels in order to plan possible entry and exit points. You notice that the price of a trade pair is conforming to a particular level over and over again you should know that is the psychological area.
Example
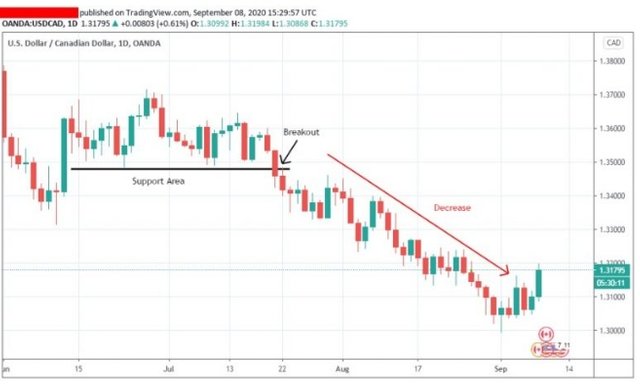
The above screenshot is an example of a breakout chart that happened between the support line. You can see that the support line is the blank line moving horizontally across the chart. Whereas the price stayed in a sideways movement for some time. This bring the creation of the consolidation within the market. At this point in time , a number of bottoms was created that lead to the support area. When the trading become breakout, it will be nice for traders to wait for a candle close beyond the resistance/support areas as means of determining breakout.
How to use Bollinger bands with a trending market? (screenshot required)
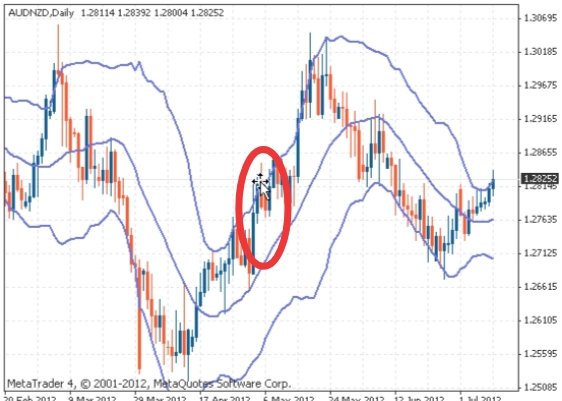
Using trending market with Bollinger Band is one of the popular trade that forex trader make use of. With the help of the market trend traders can easily identify entry signal. Without wasting time let's look at the below screenshot chart of EUR/USD in uptrend to know how to use Bollinger Bands with a trending market.
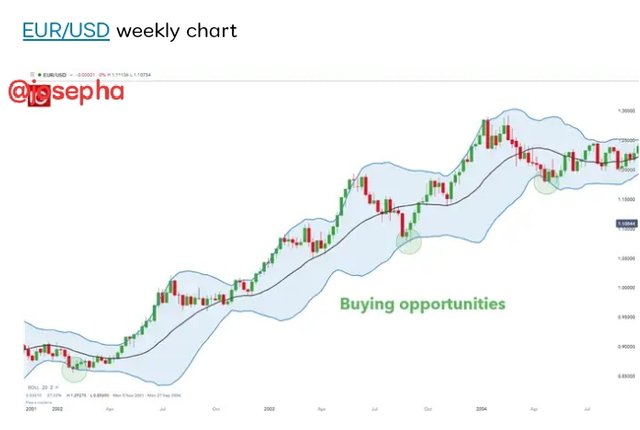
Using the Bollinger Bands trending market indicator, the lower band is seen as a gauge of support. When the price get to the lower band, traders use this signal to go for a long buy trade. This method works for uptrend and downtrend . Nevertheless the simple way to use the bollinger band with a trending market is to; first Identify the trend secondly make use of the upper and lower band as your target levels and also make use of the upper and lower bands in connection with price movement to determine your entry point.
What is the best indicator to use with Bollinger Bands to make your trade more meaningful? (Screenshot required) (Screenshot required)
There are different indicator that are created to work with Bollinger Bands to help make trade more meaningful. To me the best indicator is BBTrend Indicator.
BB Trend Indicator: this is the indicator that is created new by John Bollinger himself to work with Bollinger Bands. BBTrend Indicator is the only Indicator among all the indicators that can signal strength and direction which make it one of the most meaningful indicator. The calculations are so easy with a default periods of 20 and 50 that is shown in the indicator, although it can be changed in the parameters as shown below:
BBTrend = (lower - upper) / middleBB(20)
Upper = MathAbs(upperBB(20) - upperBB(50))
Lower = MathAbs(lowerBB(20) - lowerBB(50))
Demostration:
Bearish trend = BBTrend below zero
Bullish trend = BBTrend above zero
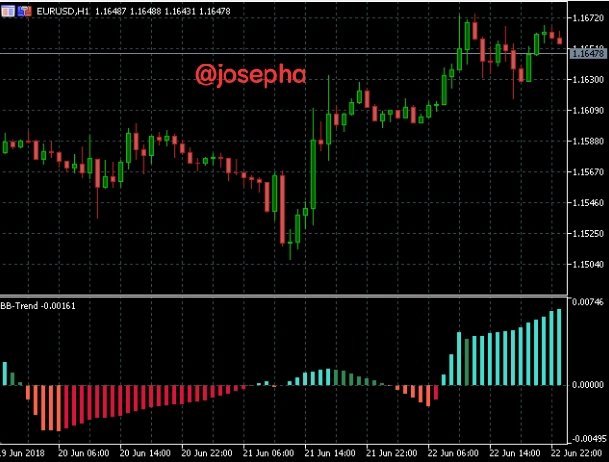
The degree above or below zero determines the strength or momentum behind the trend.
What timeframe does the Bollinger Bands work best on?And why? (Screenshots required)
I can easily say that Bollinger Bands doesn't specifically have best timeframe base on what I have study within different timeframe. I can only say that the best timeframe is depends on individual traders style and method. But I will see that as a day trader the best time to use is 15minute or 5minutes timeframe.
Review the chart of any pair and present the various signals giving by the indicator Bollinger Bands. (Screenshot required)
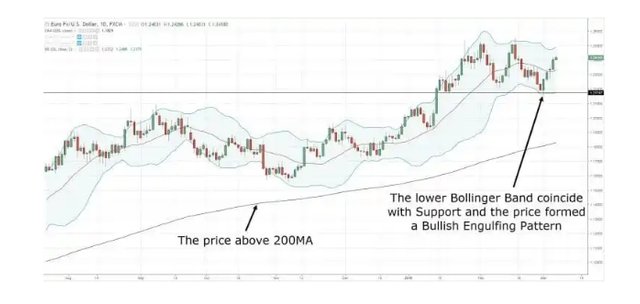
From the above screenshot is a chart of EUR/USD which is at the lower Bollinger Band that coincides with support, and it formed bullish.In other to identify overbought and oversold level the chart need to be set to 3 standard deviation in other for trade to kick off.
Unfortunately @josepha, your article contains plagiarized/Spun content
Rating 0/10
Source- https://www.investopedia.com/terms/b/bollingerbands.asp
The Steemit Crypto Academy community does not allow these practices. On the contrary, our goal is to encourage you to publish writing based on your own experience (or as per the mission requirements). Any spam/plagiarism/spun action reduces PoB's idea of rewarding good content.
Thank you.
Cc: -@endingplagiarism @sapwood
This content appears to be plagiarised as indicated by @kouba01.
If you have not already done so, you should head to the newcomers community and complete the newcomer achievement programme. Not only will you earn money through upvotes, you will learn about content etiquette;
You are currently in Stage 1 of our 4 Stage Process:
👉 Stage 1 - 1st Warning - Pointing offenders towards Achievement 3 and highlighting this process. All plagiarised posts currently pending rewards will be flagged and downvoted to $0 rewards.
Stage 2 - A Final Warning - Another request to stop and that plagiarism will not be tolerated. Downvotes amounting to 20% of total pending rewards according to steemworld.
Stage 3 - A stronger message - Downvotes amounting to 50% of pending rewards.
Stage 4 - The strongest message possible - Downvotes amounting to 100% of pending rewards.
Plagiarists will bypass stage 1 if translated from another language.
Notification to community administrators and moderators:
@steemcurator01 ADMIN
@sapwood MOD
@steemcurator02 MOD
Thank you @kuoba01 for the corrections. Actually I cited that particular words on my notepad but I forget to put the source before publishings the content is all my fault. Please I seek for pardon and promise not to do such again.
My Apology to;
@steemcurator01
@sapwood
@kuoba01
@endingplagiarism