Homework Task Subject: Steemit Crypto Academy | Course 2 | How To Read Candlestick Charts In Different Time Frame & Information about Buy-Sell(Support & Resistance)
Candlestick Charts is what traders, look up to in checking how price of assets is being fluctuate. So in this homework I will talk about how to read the green and red candles, it time frames and some vitals things that will help trader.
Explain what is the meaning of the Green and Red candle and how to read the Green and Red candle, with candles image.(Screenshot Needed)
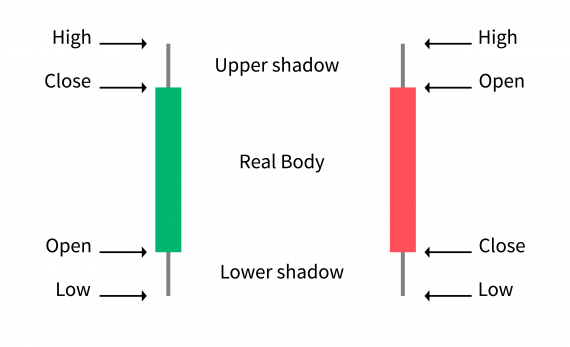
A Green candlestick mean rising prices, whereas a Red candlestick mean the price fell during the period.
The Green candle is shown on the left indicating rising in price and the Red candle is shown on the right indicating falling in price. Looking at the image above, it the shadows length tells how much the price has move up and down within a specific period of time.
How to read the Green and Red candle
Reading the Green and Red candle, it is always important that one should know that the information contain highs, low, open and the close prices.
The body are called the coloured and hollow portion. Whereas the lines that is above and below the body means the high or low ranges lines. The lines that is placed at the top of the body shows the rise and fall price, whereas as that at the bottom shows the low and extremely low close price.
As I early said the green illustrate rising in price and the red falling in price, the hollow candlesticks is where the close price is higher than the open price which tell traders to buy, whereas the coloured candlesticks close price is than open which show a sell point.
The Short bodies represents a point where the price is little above falling price this also regarded as doji. The long respresent the buy or sell is too much for traders.
Explain with Candle Chart, what are the time frames available that we can set into the chart, and why it needs to change the candle time frame? (Screenshot Needed)
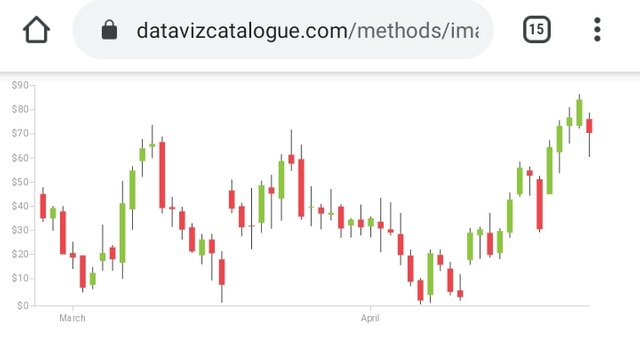
With Candle chart several candlesticks is being line up next to each other. Candlestick Charts are important for checking and predicting market trends over time and are useful for interpreting the day-to-day sentiment of the market, through each candlestick symbol's colouring and shape.
Looking at the image above candle chart involves several price information like the open price, close price, highest price and lower price through the help of of symbols. Each of this symbol is represents with trading activity for the time frames. The chart above is 5-hour where each of the candlesticks shows a 5 hour time frames.
The available time frame that we can set into the chart is 24 hours. Since, majority of the time frame is range from **1-minute, 5-minute, 15-minute 30-minute, 1-hour , 4-hour, Daily, Weekly and Monthly.
Changing the candle to a 24 hours one will have 6 candles. Let us say one change to 1minute chart, where each candle will be equal to 1minute. Every 6 hours candles will in turn become 24 hours.
Show any particular asset candle chart in a different time frame and explain in short what you see in the chart, like which trend we see, what are the price levels.
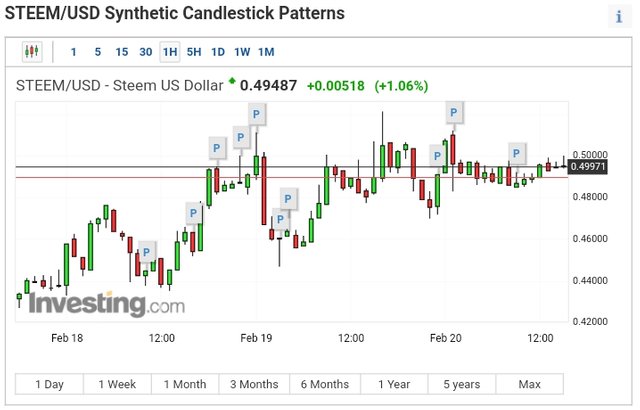
Looking at the chart the head and shoulder bottom pattern signals show that the Steem price is set to rise with it current value of 0.49487 USD.
Steem Candle chart
What type of traders available in the market, explain how they work?
The type of traders available in the market are listed and explain on how they work below:
Scalping Traders: Is the type of traders that mostly do not work with time frame of the candle chart, they aim is to achieve the available price movement.
Short Term Traders(Day traders): Is the type of trader that is only emphase on 5 to 45minutes trading they aim is just to look for the buy/sell positions.
Long Term Traders(Holding Traders): Is the type of trader that is base on 1 day or a weekly Candle. such trader is always patient until he get to his targeted price he always believe that price will surely rise.
In trading or investing in assets, what is the importance of Support and Resistance, explain how they work?
In a nutshell, the importance of Support and Resistance in trading is that they help in telling when prices are going to rise up and when they are eventually going to fall. They work by showing how prices are moving gradually in every minute of time.
How we can find the Support in the candle chart, explain with one of the asset Candle charts with screenshot and point the levels. (Screenshot Needed)
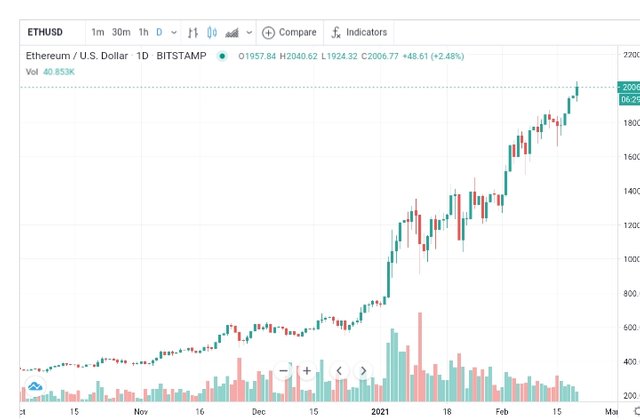
The support candle can be found in the chart any time frame either in 1 minute or even 1 month. Some of the line remain valid for years.
As you see on the ethereum chart above. The lines always stand as a point where the prices can met each other of which the candle has already sperate such in the body.
After finding Support, when and where we need to place a buy order, explain with a chart screenshot? (Screenshot Needed)
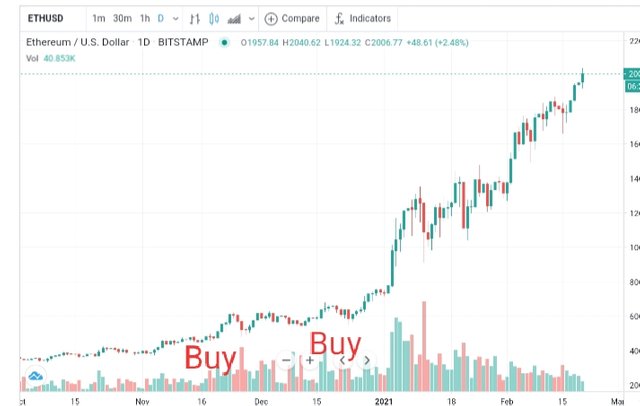
A buy order can be place when the prices has fall down .

Hi @josepha
Content in this post detected as Plagiarized which means copied and pasted from certain sources. Below are the same
It looks taken from the http://learningcenter.fxstreet.com/
PLAGIARISM isn't supported, hence can you please attach the sources to those particular phrases in your article? OR phrase/explain it in your own way.
Thank You.
@stream4u
Crypto Professors : Steemit Crypto Academy
#india #affable
Hello @stream4u, corrected as suggested
Great.
Thank You For Showing Your Intrest in Steemit Crypto Academy
You have completed the homework task and made a good post, explained very nicely about How To Read Candlestick Charts In Different Time Frame & Information about Buy-Sell(Support & Resistance).
Remark: Homework Task Completed.
Thank You.
@stream4u
Crypto Professors : Steemit Crypto Academy
#india #affable
Thanks it's my pleasure equally the task of a student to do his homework given by his/her Professor.
Thank you. Today we are going to release our third publication, I am sure you will like this also.