Crypto Academy Week 12 - Homework Post for @kouba01
INTRODUCTION

The importance of technical indicators in trading crypto can not be overemphasized. They not only help the trader to arrive at guided decisions on market entry and exit, but also ensures that losses are minimized.
This is my homework task for Crypto Academy Week 12 on Cryptocurrency Trading Using RSI.
WHAT IS THE RELATIVE STRENGTH INDEX AND HOW IS IT CALCULATED?
Relative Strength Index (RSI) is a momentum indicator that, within a given period, shows the extent the price of a cryptocurrency differs from its expected price.
In other words, RSI shows how far the price of a cryptocurrency is from its expected price. It display takes the form of an oscillator, a series upward and downward movements according to price difference from expected price.
This sophisticated indicator, which was developed about 40 years ago by Willis Wilder is capable of indicating when a cryptocurrency is overbought or oversold. It is calculated using the formula:
RSI = 100 - [ 100 / (1 + RS) ]
RS = (Av gain / Sel time ) / (Av loss / Sel time )
Sel time = The length of time the indicator considers prices (look-back period).
Av gain = The average gain during the look-back period.
Av loss = The average loss during the look-back period.
Example:
Let's consider a look back period of 14 days with closing price as the source.
Note: The source will be used to determine the loss/gain
During these 14 days under review, the following statistics were involved
| Day | Closing profit/loss | ±% |
|---|---|---|
| 1 | profit | +1.2 |
| 2 | profit | +1.1 |
| 3 | loss | -0.9 |
| 4 | profit | +0.9 |
| 5 | loss | -1.1 |
| 6 | loss | -0.6 |
| 7 | loss | -0.7 |
| 8 | profit | +0.9 |
| 9 | profit | +0.9 |
| 10 | profit | +0.9 |
| 11 | profit | +1.0 |
| 12 | loss | -0.8 |
| 13 | loss | -0.9 |
| 14 | loss | -0.7 |
From the data above, 7 days had the prices closing at profits with an average profit of 1%, while the rest 7 days closed at losses with an average loss of 0.8%.
Av gain = 1%
Av loss = 0.8%
Sel time = 14 days
RS = ( 1% / 14 ) / ( -0.8% / 14 )
RS = 1.25
RSI = 100 - [ 100 / (1 + 1.25) ]
RSI = 55.555555... ~ 55.56
This is the calculation for the initial RSI. There's another formula that is used to enhance the RSI. However, this calculation was not included in this course.
CAN WE TRUST THE RSI ON CRYPTOCURENCY TRADING AND WHY?
The RSI is not to be used as a stand alone indicator for technical analysis. Using the RSI alone might give false indication sometimes. However, if it is used in conjunction with other technical indicators like support, resistance, double top, double bottom, moving average, stochastic RSI, etc. it can be to a reasonable extent, trustworthy.
That is not to say that precautionary technical tools like stop-loss shouldn't be employed to limit losses in the case of the unexpected.
We can not trust the RSI if it's used alone because it can give false signals sometimes.
HOW DO YOU CONFIGURE THE RSI INDICATOR ON THE CHART AND WHAT DOES THE LENGTH PARAMETER MEAN? WHY IS IT EQUAL TO 14 BY DEFAULT? CAN WE CHANGE IT?
Configuring the RSI on the charts is quite easy. Here's a demo of setting up RSI on Huobi.
SETTING UP RSI ON HUOBI
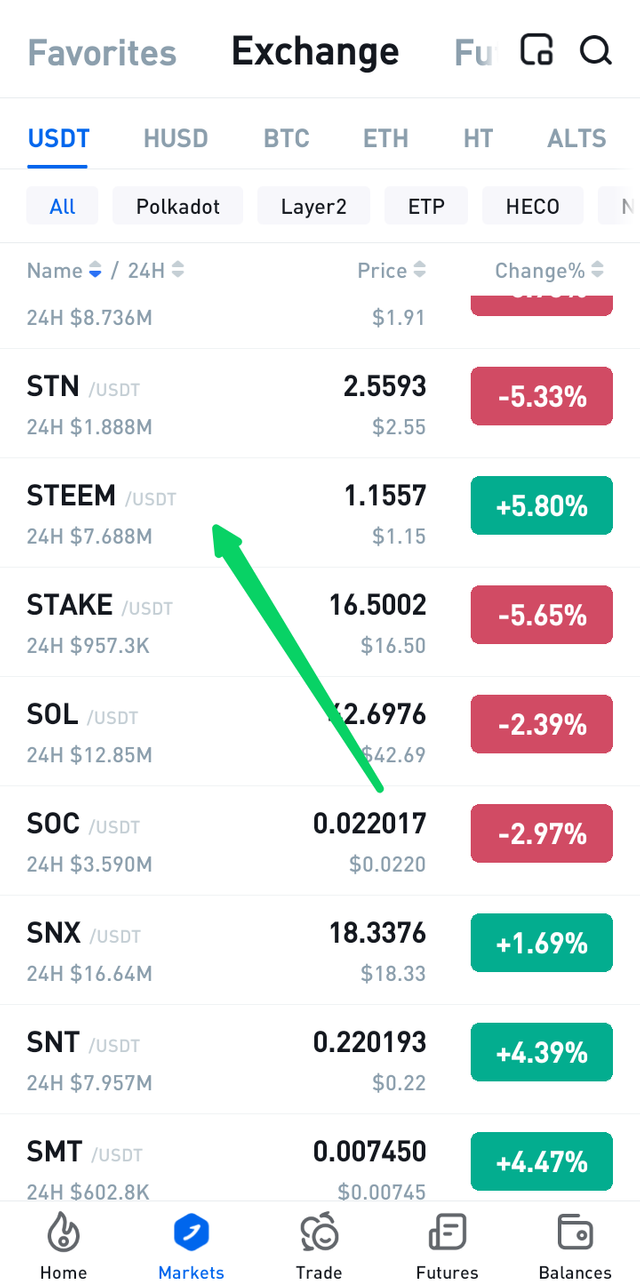
On Huobi, select any pair, eg. Steem/USDT
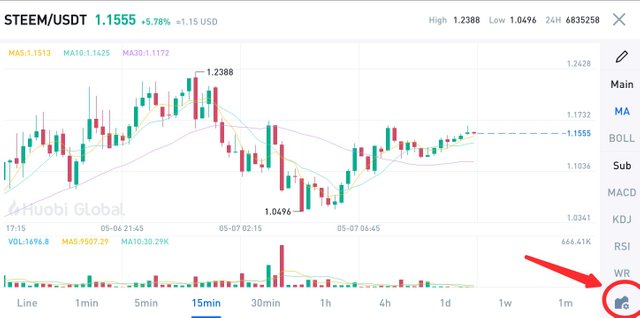
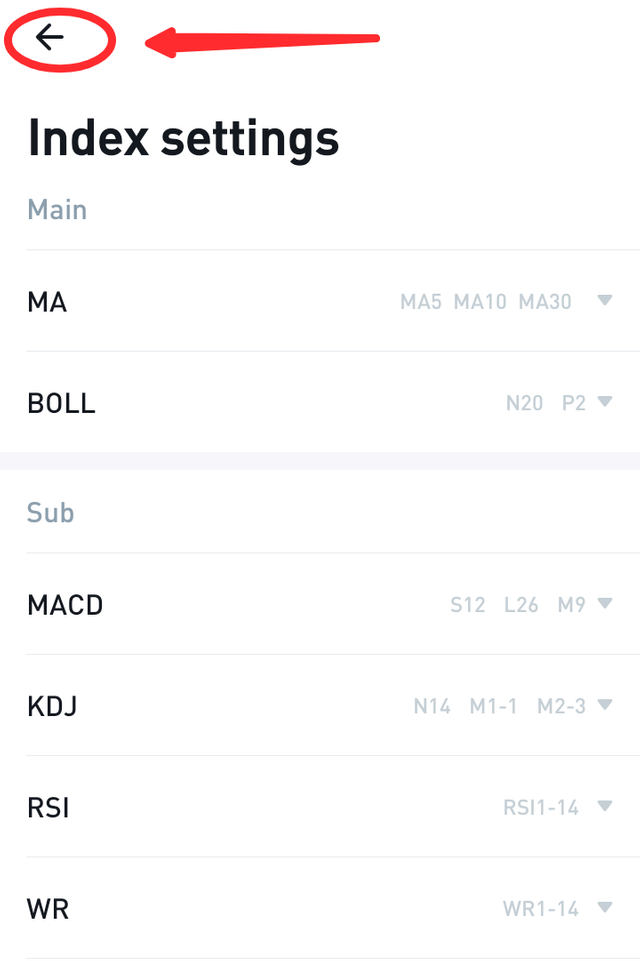
Next, click on the index settings icon at the bottom right.
Then scroll down to find the RSI and click on the drop-down beside it.
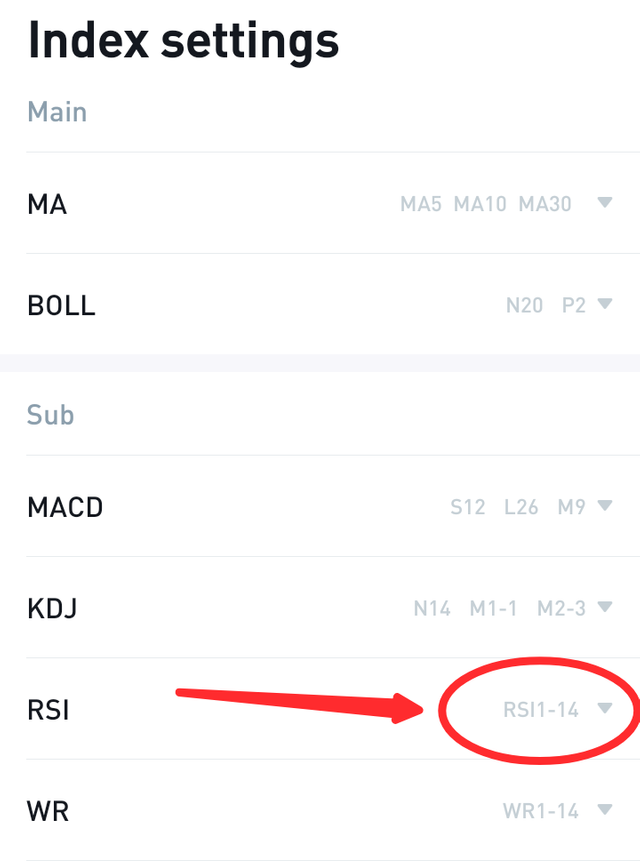
Next, you can them set the length parameter. There are 3 options for the length parameter - RSI1, RSI2, RSI3. RS1 is the default at 14 while RSI2 & RSI3 can be customized.
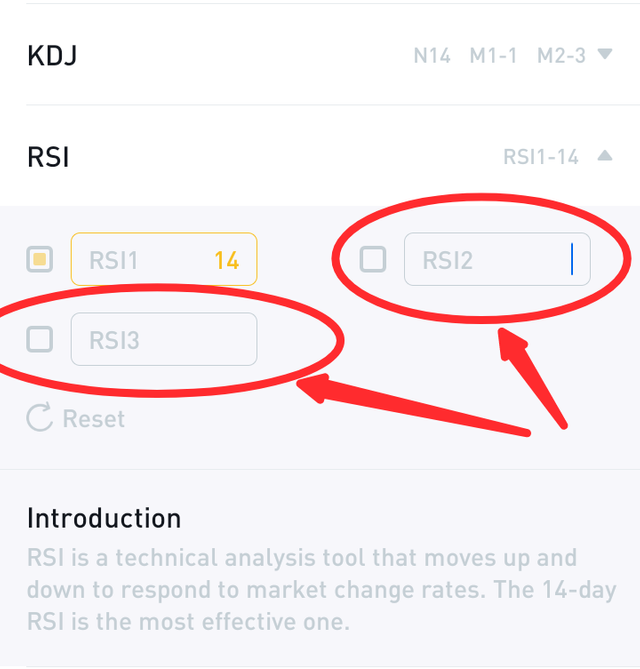
On Huobi, you can only set the length parameter, you can't set the font or the source.
After setting the length parameter, click on the return arrow above 'index settings' to return to the chart.
On the chart, click on RSI on the right tab (red arrow) to display the RSI.
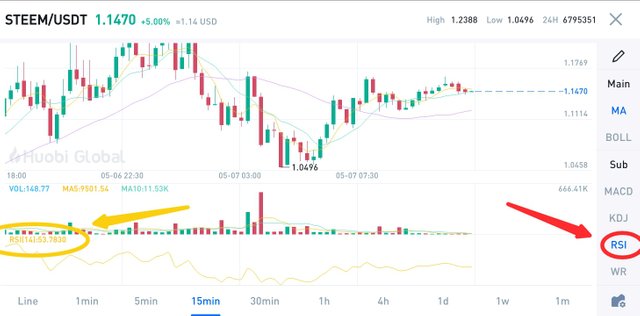
You can find the current position of the RSI in the yellow-circled portion on the left in the image above.
THE LENGTH PARAMETER
The length parameter in RSI is the number of candlesticks the RSI indicator takes into consideration in determining the magnitude of the price variation from the expected price. It is the number of candlesticks that make up the look-back period of the RSI.
If it's 14 on a 1 day chart, it implies that the price data of 14 days will be taken into consideration to calculate the RSI.
If it's 15 on a 1hr chart, it implies that the price data of 15 hours will be taken into consideration to calculate the RSI.
The length parameter is equal to 14 by default. This is suitable for many traders and also, it was the recommended smoothing period by Wilder, the founder/inventor of RSI src
The length parameter can be changed. I explained this in the demo on setting up RSI on Huobi above.
HOW DO YOU INTERPRETE OVERBOUGHT AND OVERSOLD SIGNALS WHEN TRADING CRYPTOCURRENCIES?
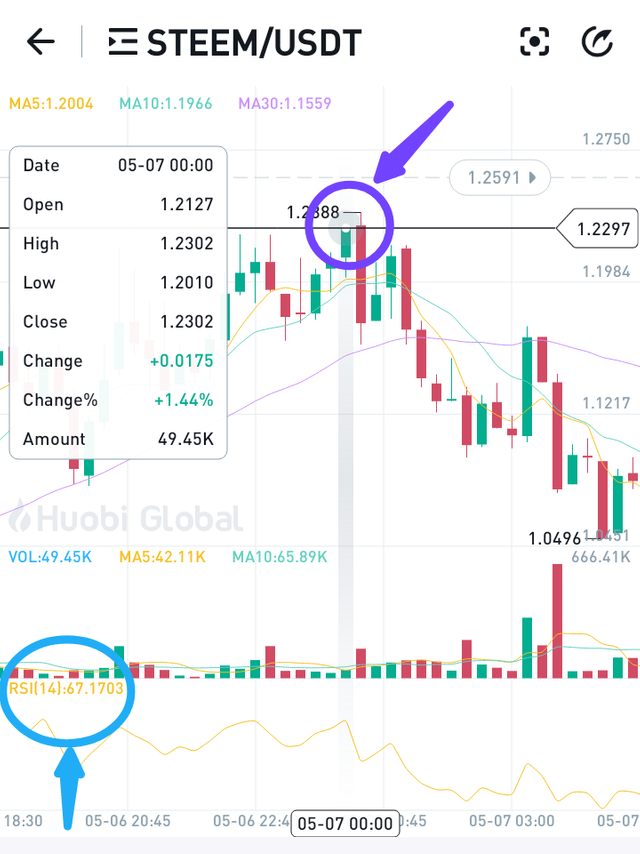
On Huobi, you may not find those '50', '30' & '70' lines drawn but you can find out the exact point on the scale of 0 - 100, where the RSI is. This point is highlighted in purple below
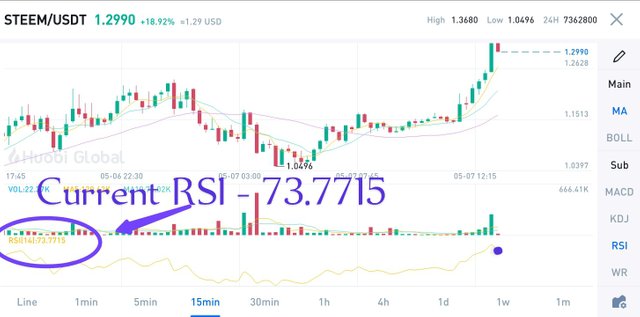
From the reading, we can see that the RSI is at 73.7715.
Now, generally,
RSI > 70 - Overbought
RSI < 30 - Oversold
So, from our screenshot above, the price which is 73.7715, is overbought.
OVERBOUGHT
When the RSI goes above the upper limit (70) it means that the price is much higher than expected. It's expected that the market would usually readjust to within the expected price range. Overbought suggests a SELL action.
OVERSOLD
When the RSI goes below the lower limit (30) it means the price is much lower than expected and since the market would usually readjust to within the expected price range, oversold suggests a BUY action.
Huobi doesn't offer RSI on a calibrated scale. If you want to know the RSI on any point, just click on the candlestick directly above that point and read the RSI value.
HOW DO YOU FILTER RSI SIGNALS TO DISTINGUISH AND RECOGNISE TRUE SIGNALS FROM FALSE SIGNALS?
To discover true signals in RSI, we need to combine RSI with other indicators and look for a phenomenon called divergence. Divergence can either be bullish or bearish. It is also a very important factor in differentiating true from false signals.
BULLISH DIVERGENCE
One of the true signals in RSI is the bullish divergence. This occurs when the RSI indicates a higher low but the price action indicates a lower low.
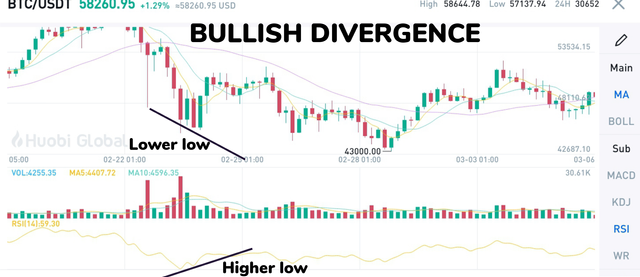
This signals that the market is about to reverse. For instance, in the image above, the price of BTC went up just after the bullish divergence.
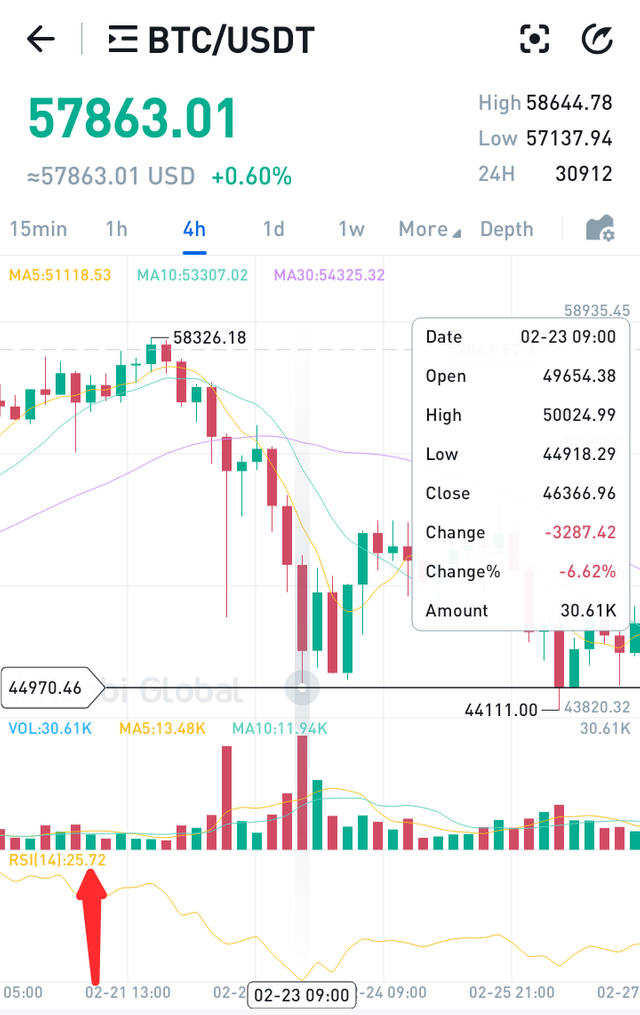
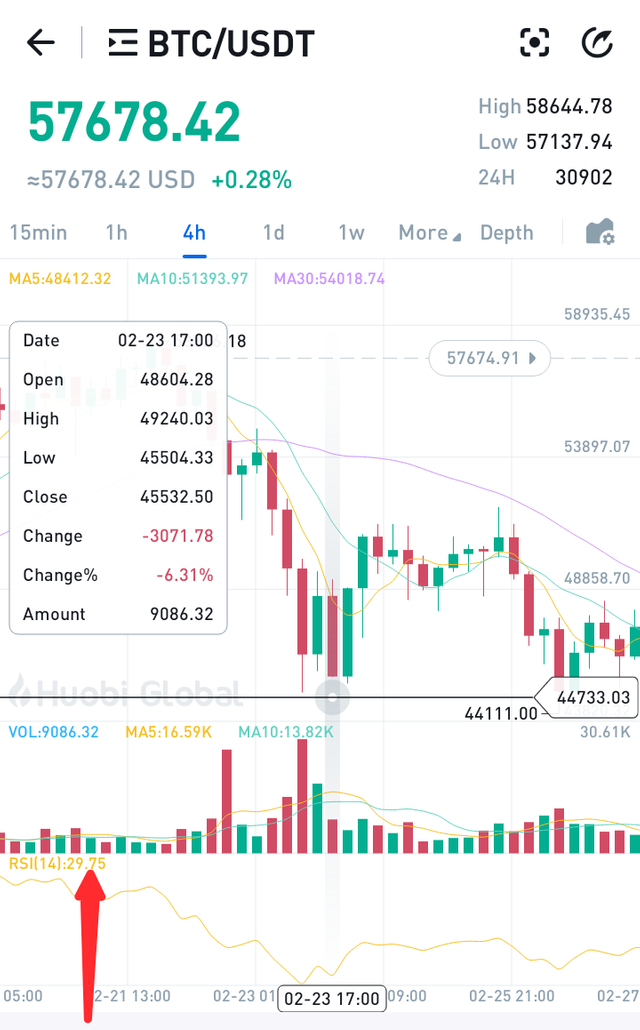
This reversal is especially true when it occurs in the oversold zone like in the instance above. Both lows were below 30. See proof below when I clicked on the spaces above those lows
BEARISH DIVERGENCE
Another true signal in RSI is the bearish divergence. It occurs when the RSI indicates a lower high but the price action indicates a higher high.
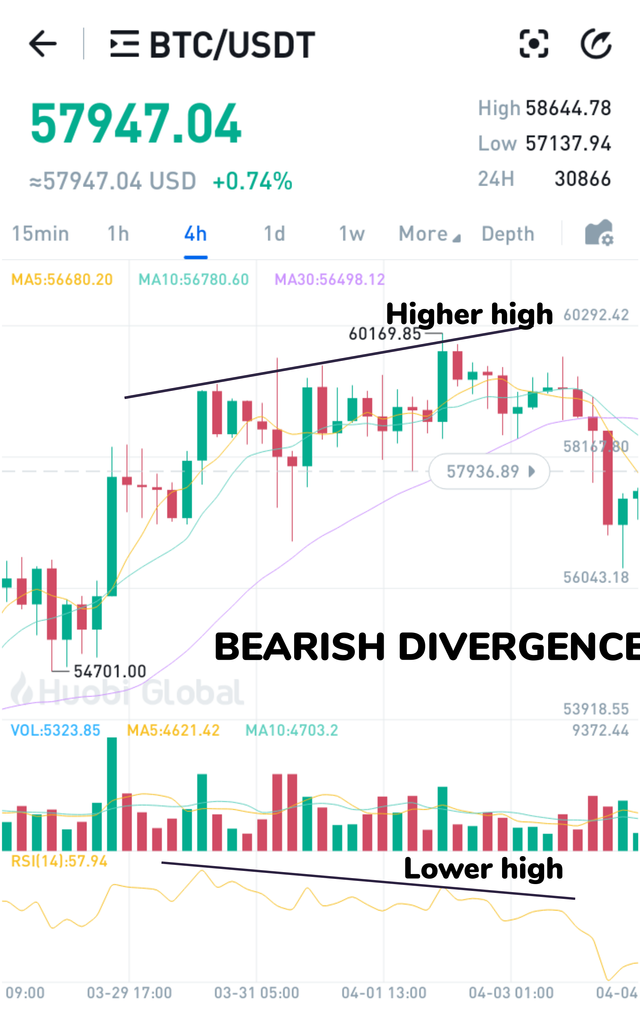
The bearish divergence is also a strong reversal signal. From the instance above, the price of BTC dropped after the bearish divergence.
This price reversal signal is stronger when it occurs in the overbought zone.
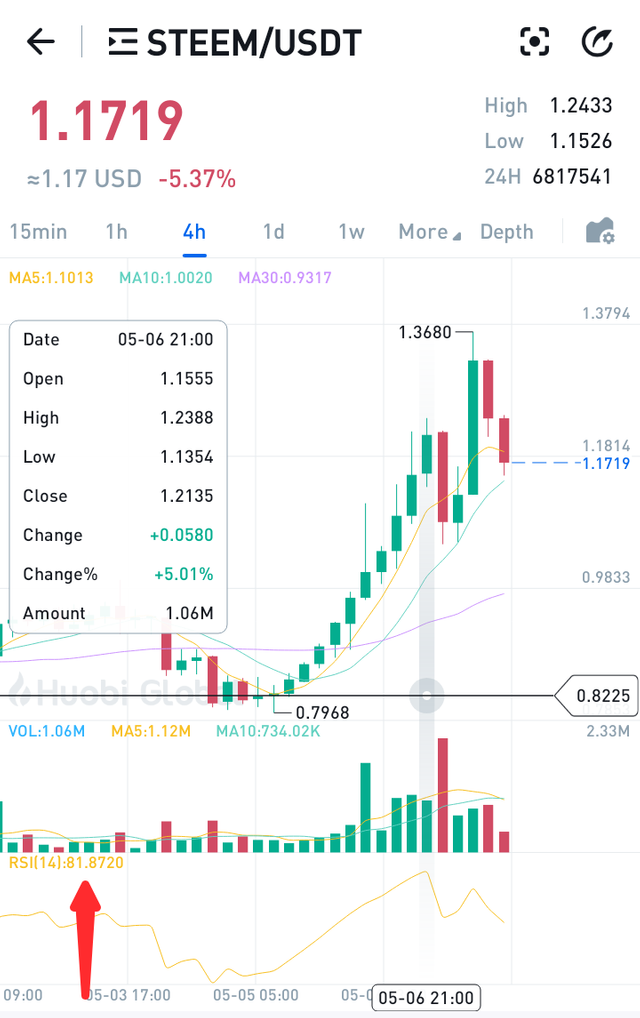
A REVIEW OF THE RSI ON A 4HR-STEEM/USDT CHART
Below, I'll review the RSI on a STEEM/USDT 4hr-chart on Huobi pro.
Because Huobi pro does not offer RSI on a calibrated scale but gives the exact readings for each point, I'll be using two instances of 1 chart to show the different RSI
RSI = 81.872
RSI = 74.9175
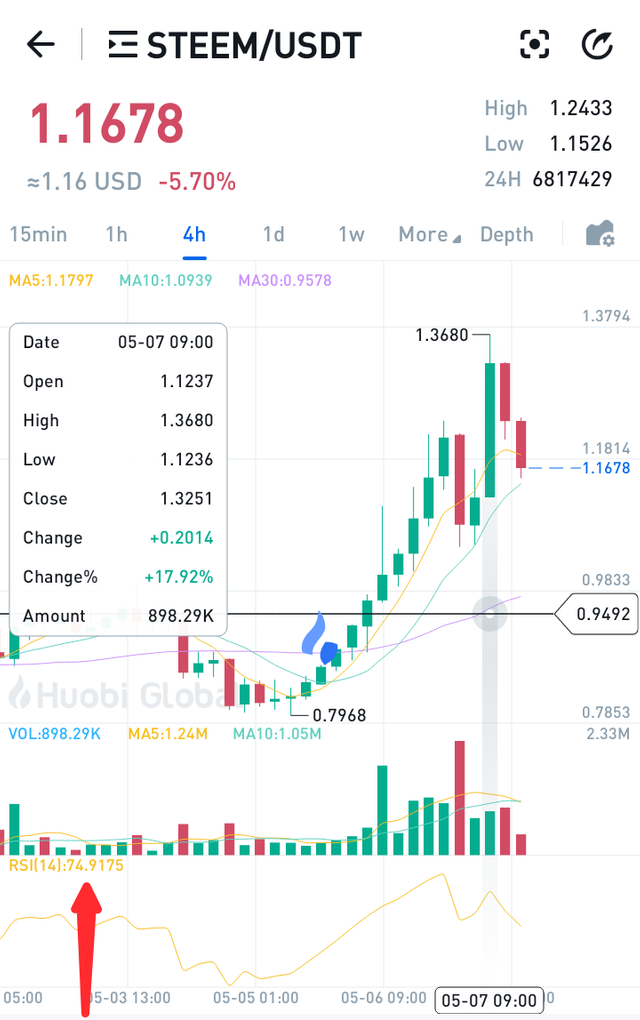
From the chart above, we see a bearish divergence has formed as the price action is indicating a higher high but the RSI is indicating a lower high. Just after this, we can notice the price dropping.
Looking at the RSI of both peaks, we notice that they are both over 70. This means there's a strong reversal signal as the bearish divergence is happening in the overbought region. Also, because the RSI are above 50, it implies the market is in an uptrend.
CONCLUSION
Perhaps, one of the most trusted indicators, RSI is a very useful tool to traders when used correctly in combination with other technical indicators.
RSI informs the trader when the price is overbought and oversold. The divergences also gift the trader an invaluable reversal signal especially when they occur above and below the upper and lower limits respectively.
Thanks for reading.
Cc:
@kouba01
@tipu curate
Upvoted 👌 (Mana: 5/6) Get profit votes with @tipU :)
Thank you so much for coming around.
Hello @jehoshua-shey,
Thank you for participating in the 4th Week Crypto Course in its second season and for your efforts to complete the suggested tasks, you deserve a 9/10 rating, according to the following scale:
My review :
Excellent article content. I really enjoyed reading it. Your answers are well detailed and clear on the RSI Trade Indicator. Regarding the signal filtering question, it could have expanded further.
Thanks again for your effort, and we look forward to reading your next work.
Sincerely,@kouba01
Thank you so much professor. I'll improve on my explanations next time.