SteemitCryptoAcademy Week16, Home-work Post for [@stream4u]..Technical Indicator: Pivot Points
(1).Discussed your understanding of Pivot Points. (Title For this topic will be Pivot Points)
Pivot Points is known as a technical analysis indicator designed to identify and check support and resistance level of a market movement. pivot points is used by traders to enable them determine market trend. It is calculated using an average of high price, low price and close price to show the performance of a market in the previous day trading.Any trading that is above the pivot point is known as a bullish, but if it's below is known as a bearish. Pivot points is mostly used by Day traders to determine they levels of entry, profit and stops.
(2). Details about Pivot Point Levels
There are several levels of Pivot points, for the purpose of this homework post let's look at the ones given below:
PP: this indicate Pivot Point, that is shown at the top of a graph telling telling when they are to take profit.
R1: this stands for Resistance 1 level and it's above the PP level at the top.
R2: This stands for Resistance 2 it is above the R1 level.
S1: This stands for Support 1 level this levels tell when price will be stable.
S2: This stands for Support 2, that is usually below the S1.
(3).Pivot Point Calculation and R1 R2 S1 S2 Pivot Levels Calculation.
In the post I make used of the five-point system which is one of the best technique that traders use in calculating pivot points. This technique make used of the High, Low, and Close including the **Support and Resistance levels. Below is how this five-point system is being used to calculate pivot point.
PP = High + Low + Close / 3
S1 = (PP × 2) - High
S2 = PP - (High - Low)
R1 = (PP × 2) - Low
R2 = PP + (High - Low)
Where:
| Words | Meaning |
|---|---|
| PP | Pivot Point |
| S1 | Support1 |
| S2 | Support2 |
| R1 | Resistance1 |
| R2 | Resistance2 |
(4).How to Apply Pivot Point on Chart. (Screenshot with tag your name)
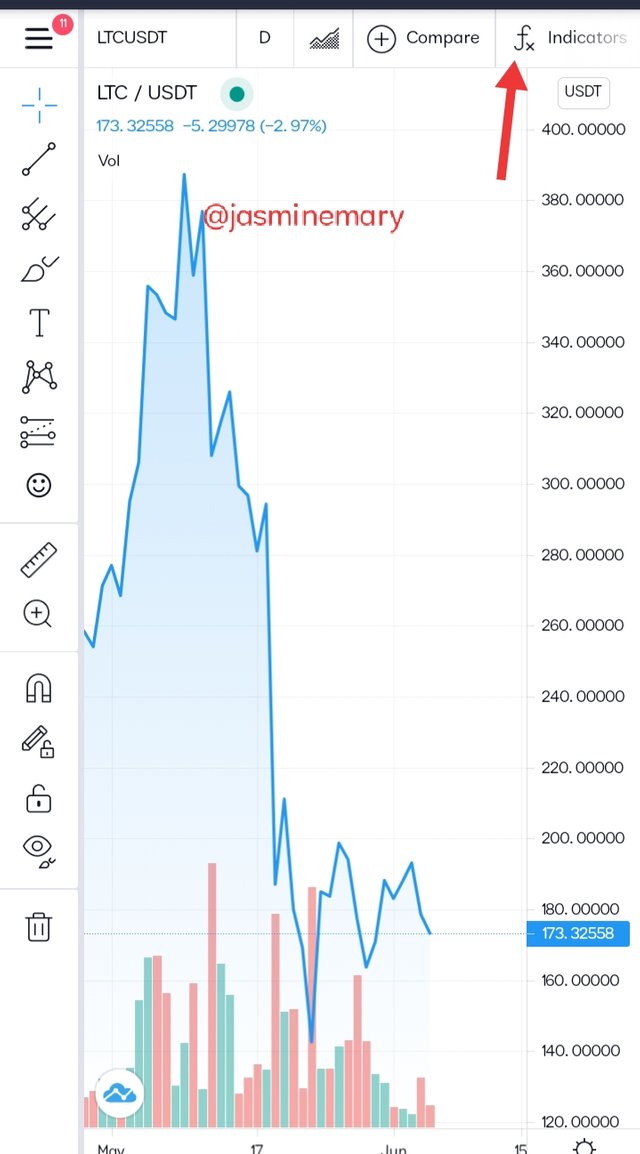
I apply Pivot point on chart with the help of TradingView.
- While on the Candlestick chart I click on the **fx that is indicator and the strategies.
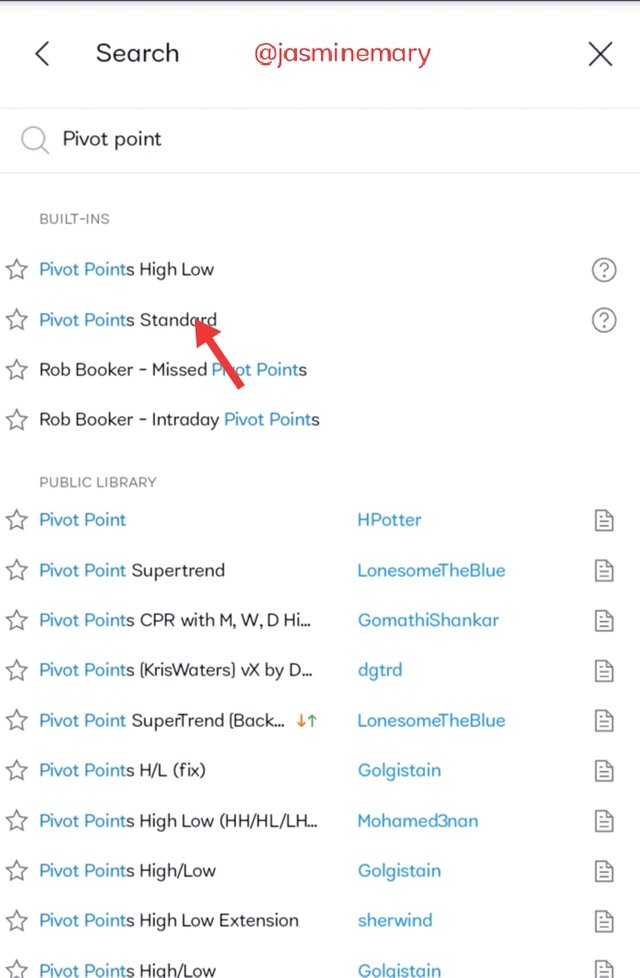
- Under Candlestick Pattern, I then search for Pivot Points. There are many pivot point that I see but I only select you will see, but I Only select Pivot Points Standard. I select it and apply the chart.
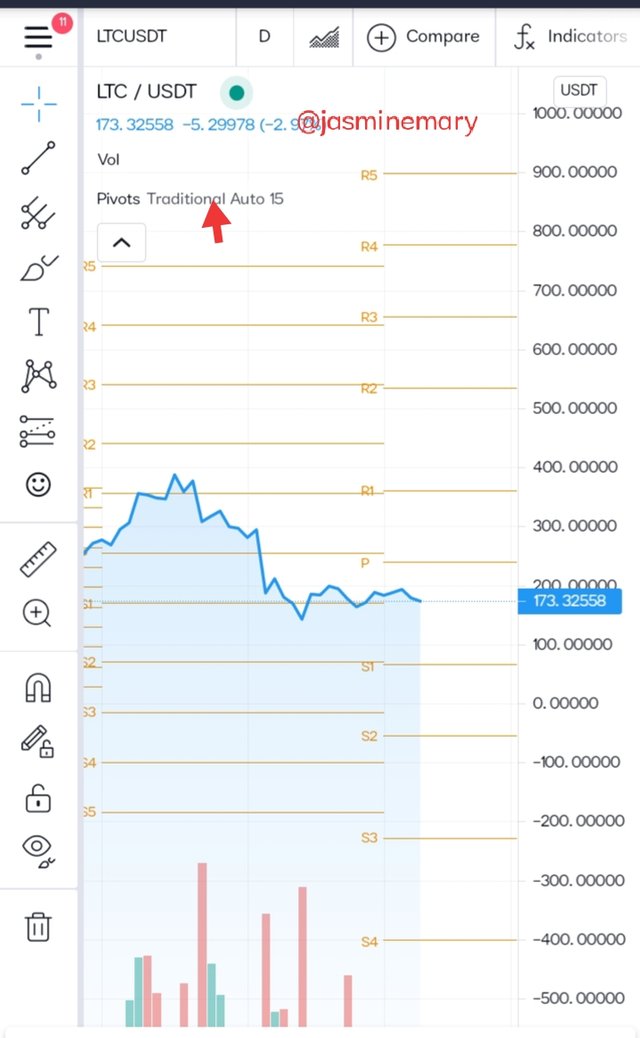
- After i apply Pivot Points on a chart, I see something as shown below.
Configuration Of Pivot Points
- Under the Type,i see a lot of options as mentioned above such as Fibonacci pivot points, Woodie’s pivot point, Demark Pivot Points, and Camarilla Pivot Points, I then make use of Traditional.
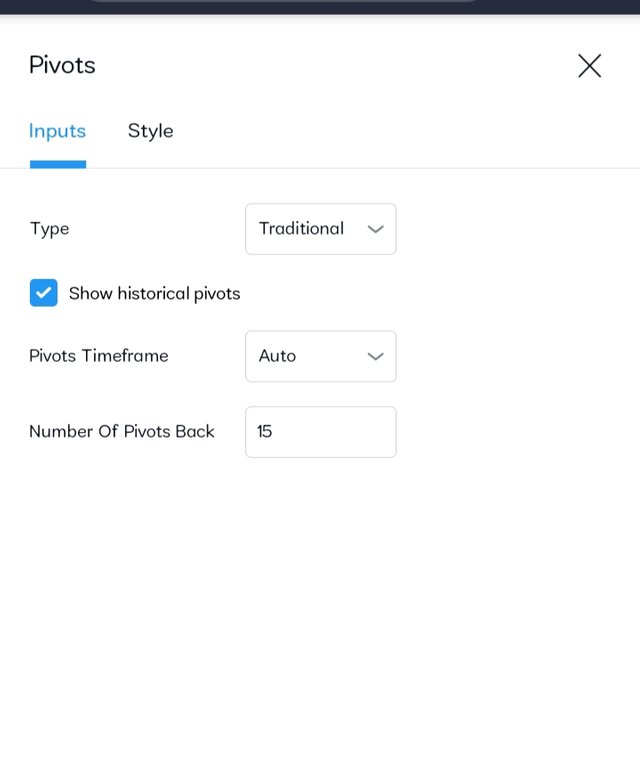
- The timeFrame is Auto.
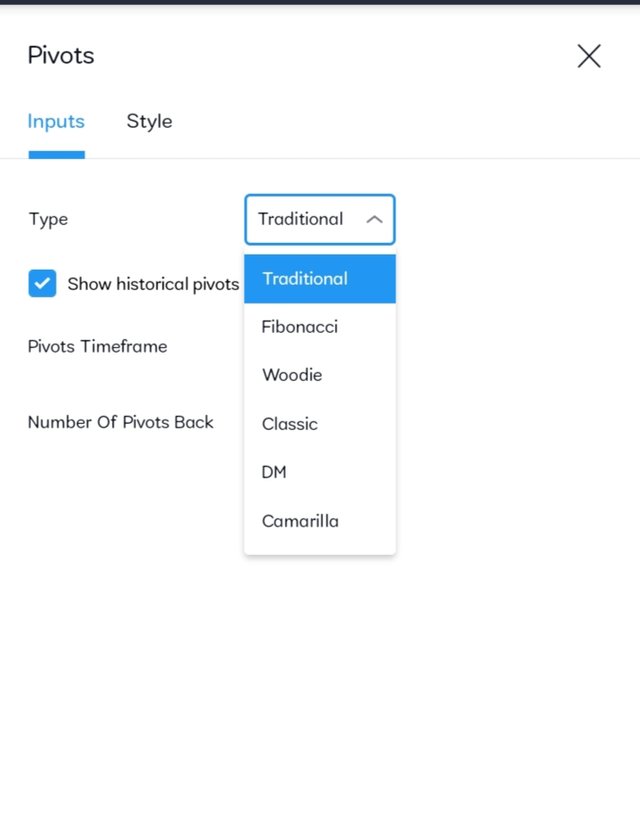
- The number of Pivot is 15.
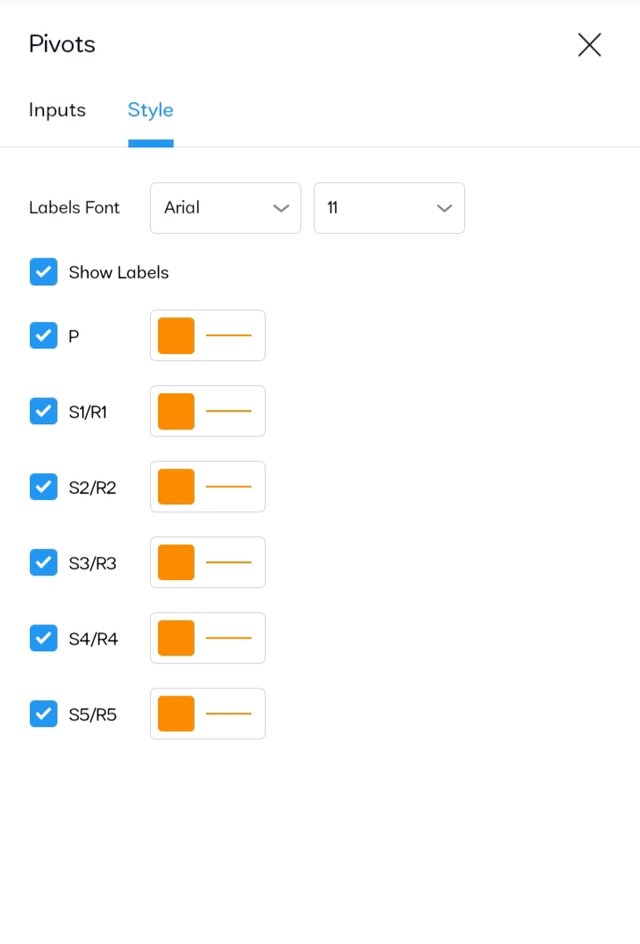
Under the style, I see additional S4/R4, S5/R5 which I used tol uncheck as there is only S3/R3. There are several color for R1, R2, R3 is RED because its represent resistance level, and Green or any color you can give for S1, S2, S3. In Trading View the color for S1 will also apply to the R1, similar to other levels as well.
(5). How Pivot Points Work. (Screenshot with tag your name)
The pivot point simply work as a previous day trading applying Support and Resistance and also the High, Low and Close price in it. At the chart you will see all of name as mention. It also work when it's plot on a smaller span. For a example if trader wish to calculate his pivot point, the trader will start from the previous day to calculate down to the current day. For a 5M chart pivot work as a technique that indicate when price will change. The pivot also work when the first and second pivot levels are high for selling in the previous day strength in the bearish market. At this point trader will set they own sell levels a below the pivot point.
(6).Pivot Point Reverse Trading. (Screenshot with tag your name)
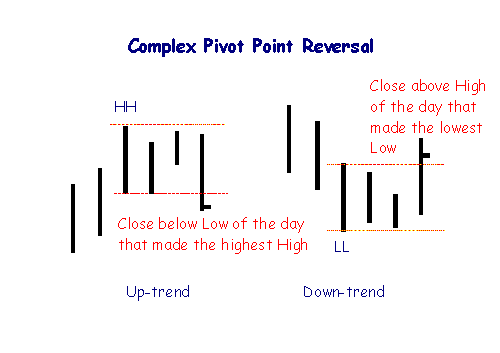
Pivot point Reserve help to display how prices are being react with different level in the market such as the high low and close price levels. In a situation where the close price is below the low level for that day the pivot point will become uptrend. Whereas if the pivot point is above the high price for that day the pivot point will become downtrend have a lower price.
(7). What could be common mistakes in pivot point trading
There are so many mistake attached to Pivot point trading. But the most common mistakes are as follows;
- There so many consistent strategy in the market.
- pivot point is hard to indicate the current price.
- lack of demand and supply.
- Getting of time frames is very difficult
- The pivot point line is something seen in a wrong directions.
(8). What could be the reasons For Pivot Points is Good.(Pros/Advantages)
The reasons for Pivot points good is that in the bearish Market pivot point levels is used as a breakout in the market, which allow trader to buy on break when the it is high low and close. Pivot point is also good in the bullish market when the first pivot point level in the previous day trade are weaken. In the strong or bearish market, the pivot point is good to used and target price entry for the purchase of weak and selling strength.
(9). Apply the Pivot Points indicator in the Today chart (the day when you making this task) and set the chart for 15 minutes. Explain the market trend till the time of writing the task and how it will be next till the end of the day. You can give possibilities on both the side bearish and bullish.
Today being June, 5 is when is apply the Pivot point indicator chart using LTC/USDT pair. The price of LTC which is 172.61400 is at the S1 line below the Pivot point (P) and the resistance levels. Looking at the above chart you can see that the Grey color indicate the pivot point of S1, S2, S3, S4, S5 which are all bearish. The R1, R2, R3, R4 and R5 are the bullish ones that is above the P levels.
(10). Weekly Price Forcast For Litecoin (LTC)
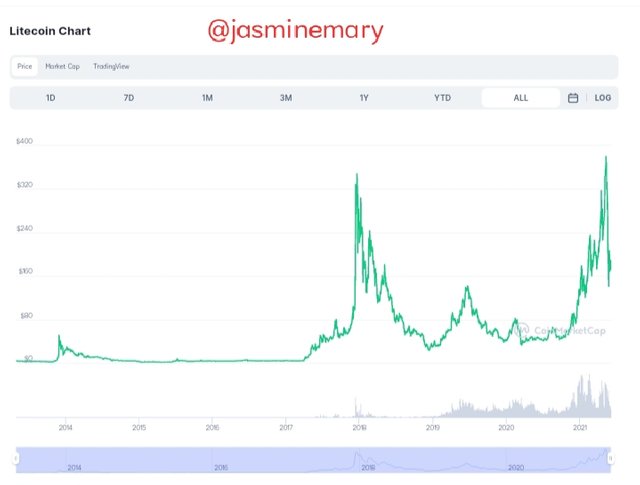
Today being June, 5: LTC price is $172.44 USD with a 24h trading volume of $2,615,637,584 USD. According to the data gotten from Coinmarketcap. Looking at the forecast in the next one week starting from today. June, 6: LTC $171.02 USD. June,7: the price of LTC will be $170.02 USD which is bullish base on it current price. From Tuesday June, 8 to June 12: LTC will become Bullish with and increase of 24% which the price will rise to $178.563 having a maximum price $179.000 for that day.
Hi @jasminemary
Thank you for joining The Steemit Crypto Academy Courses and participated in the Homework Task.
Your Homework Task verification has been done by @Stream4u, hope you have enjoyed and learned something new.
Thank You.
@stream4u
Crypto Professors : Steemit Crypto Academy
#affable