Steemit Crypto Academy | Season 3: Week 7 || How to create an account on TradingView, how to use indicators,tools, features of tradingview
Hello Fellow steemians hope we all had a good previous learning weak this is my assignment post for Professor @yousafharoonkhan
Question no 1:
Defining the TradingView site and how to register an account in tradingview? what are the different registration plan?(screenshot necessary)
Tradingview
Trading view is a popular web-based and app based platform where users (traders, investors etc.) can observe and analyse all sorts of charts on crypto, fiat stocks etc. the trading-view platform provides access to charts of all sorts and displays current market prices in realtime, it was invented in the year 2011 September by a strategist called Stan Bokov with the sole aim of educating and assisting users. Tradingview is currently the most used chart rending platform and users whether beginners or pros know to utilize the platforms amazing plans
How to register an account in tradingview?
I will be showing you how to create a trading view account on Chrome windows
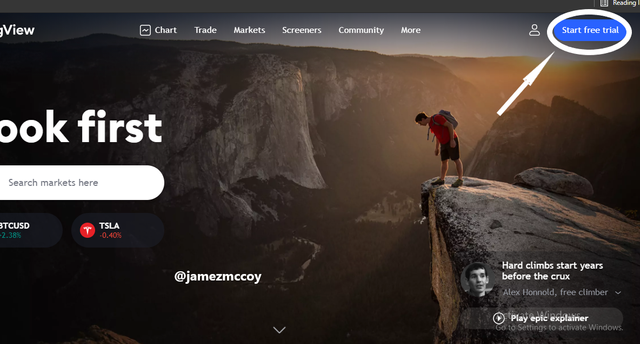
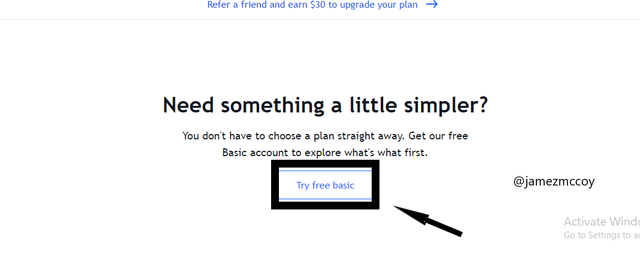
- Step 1
Go to TradingView official website and click on the start free trial button and select the try free basic as indicated in the with further details in the images below
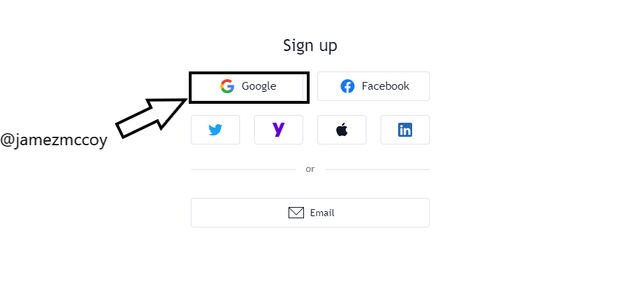
- Step 2
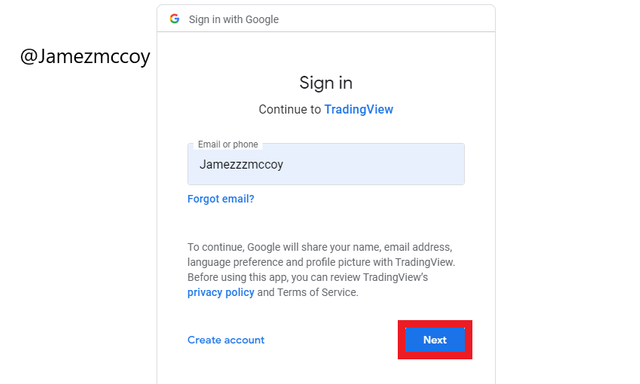
After completing the steps above you will be asked to choose a sign in method of which I would strongly recommend using google as it is the safest and fastest sign up method. You would be required to sign-in with your google account as indicated in the images below
- Final Step
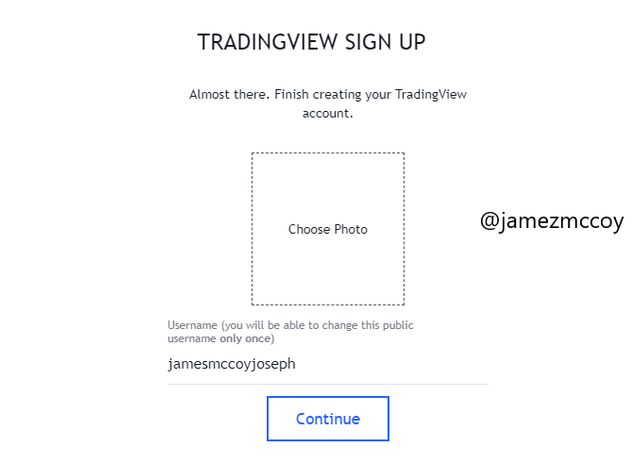
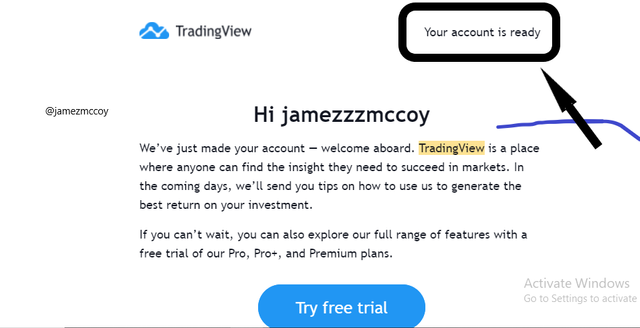
After successful sign in with your email you will be required to customise your name if needed and add profile picture as indicated in the images below, and that's it your account has been successfully set up
What are the different registration plans?
The Tradingview offers 4 different packages including basic which is automatically selected for new users who are not yet on any plan, the other 3 packages are offered on 2 different types of durations which are annually and monthly
- Basic
- Pro
- Pro+
- Premium
- Basic
This plan is a plan that is automatically added to a new user who has not made any form of payment for loan upgrade and is yet to do so, the basic plan comes with lots of limitations one of which I find the most disturbing to be the ads that pop up on the chart while doing analysis
Pro
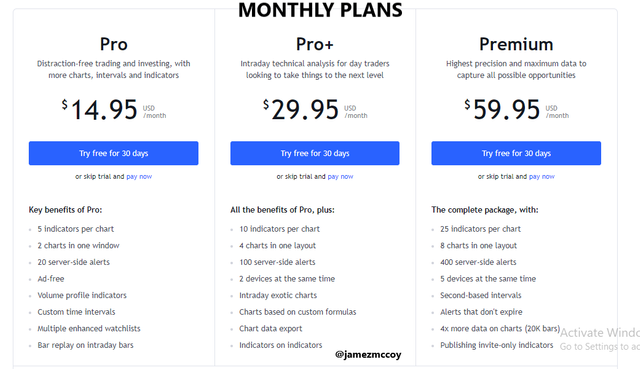
The Pro Plan is the least plan offered by the TradingView Platform on 2 different time durations, For monthly the charges are 14.95 USD per month while the annual pro plan comes with a 155USD. The benefits of using the pro plan include
- Access to customer support
- Ads Free chart
- Social forum
- Up to 5 chart per indicator
Source
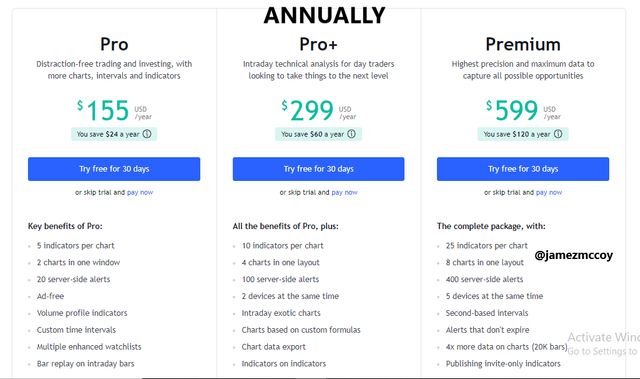
PRO+
The pro plus is more or less an upgrade from the pro feature which comes with a monthly subscription charge of 29.95$ and an annual subscription of 299$, but the main advantage personally here is the added number of devices you can have the chart on multiple devices running concurrently. the main benefits of theis package are
- 10 indicators per chart
- 4 charts in one layout
- 100 server-side alerts
- 2 devices at the same time
- Indicators on indicators
Source
Premium
This is the highest package the TradingView platform has to offer and it comes with all the features included and even has up to 5 devices allowed to run concurrently at the same time, it comes with a monthly subscription fee of 59.95$ while an annual subscription fee of 599$. The Premium class has all-inclusive features some of which are
- 25 indicators per chart
- 8 charts in one layout
- 5 devices at the same time
- Alerts that don't expire
- Publishing invite-only indicators
Source

Question no 2:
Explain the different features of trading view and what is your favorite feature and why? (screenshot necessary)
6 features are clearly seen upon opening the TradingView website , this features include
- Chart
- Trade
- Market
- Screeners
- Community etc
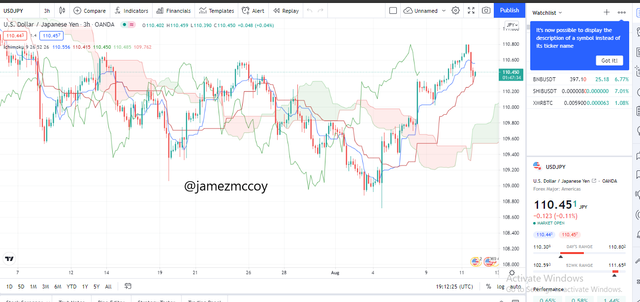
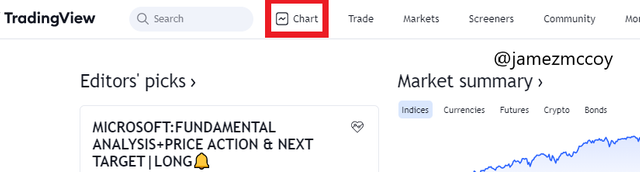
CHART
The chart is one of the most prominent and most used features of the Tradingview website, here one gets to keep up with all the price movements do analysis and gets to choose from among the vast range and varieties of indicators in the platform. The chart feature helps traders to carry out analysis on assets and predict the future movement of assets on the chart, below is a typical example of a chart
TRADE
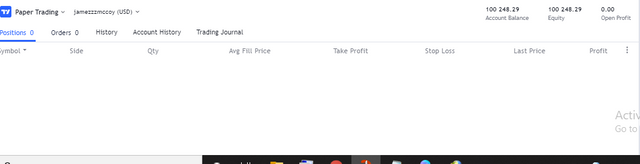
The trading feature allows an individual to trade assets with the available brokers which are provided to one by the TradingView Platform. The platform has a trading feature called Paper-Trading for those learning to trade, a demo account is giving for practice
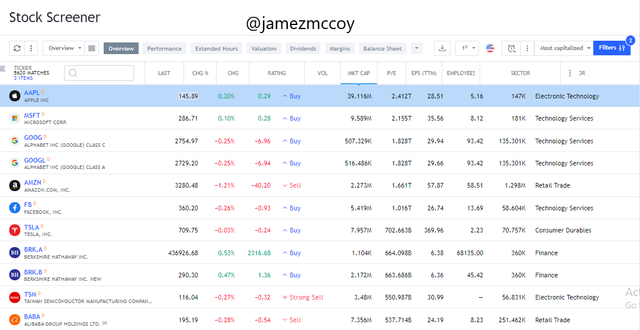
MARKET
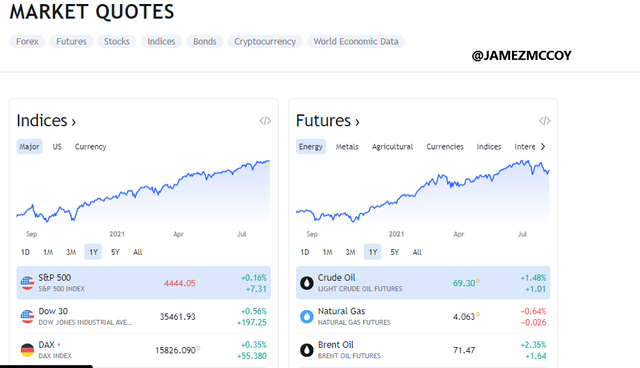
In the market feature, one gets to see prices and an overview of varieties of assets in a broader and simplified view, unlike in the traditional crypto market where one gets to buy and sell in a crypto market here one gets to keep up or intrack with the current prices of assets ranging from crypto to forex, etc.
SCREENER
They are currently 3 different screeners Forex, Crypto, and Stock screener. This feature enables a user to quickly and easily without wasting time to sort through each asset individually to look for one that meets one's specification. In a nutshell, Screeners are tools that enable a trader to sort through lots of assets that meet some of his specifications in a very convenient way
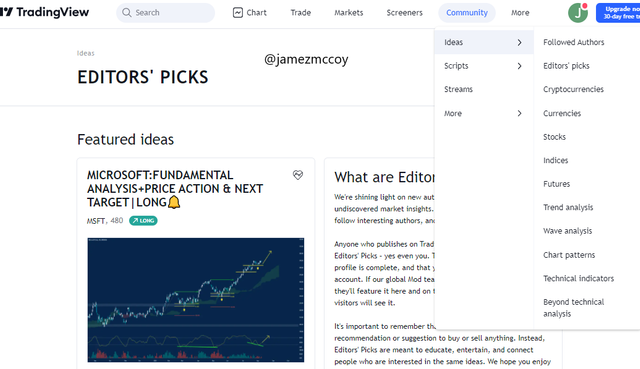
Community
As the name implies this is an environment where individuals gather together from all around the world to share insightful ideas and thoughts on assets, here you get to see featured Editors thought and peoples predictions of trend analysis, Basically this feature enables users to share ideas and perspectives on things concerning the trading world
What is your favorite feature and why
The chart is my favourite feature cause as a trader the basis of fundamental analysis and trading entirely is the ability of one to interpret and understand charts, absolute knowledge of the chart feature helps reduce lost in trading by a lot, hence the chart is the most important feature of TraadingView platfrom
Question no 3:
How to set up a chart in TradingView and use two tools to edit it.(screenshot necessary)
- Step one click on the Chart feature from the Trading View
- Step 2
To personalize your chart they are many chart options available on tradingView platform some of which are
- Candle
- Bar
- Area
- Baseline etc
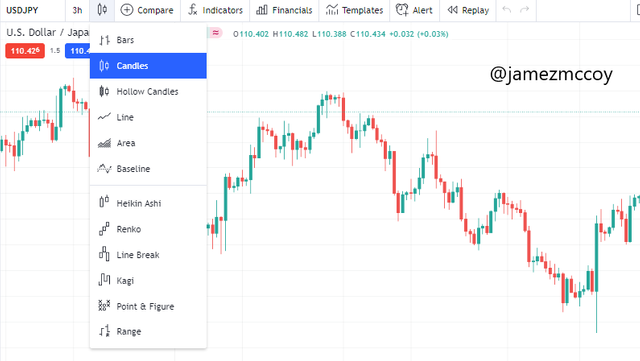
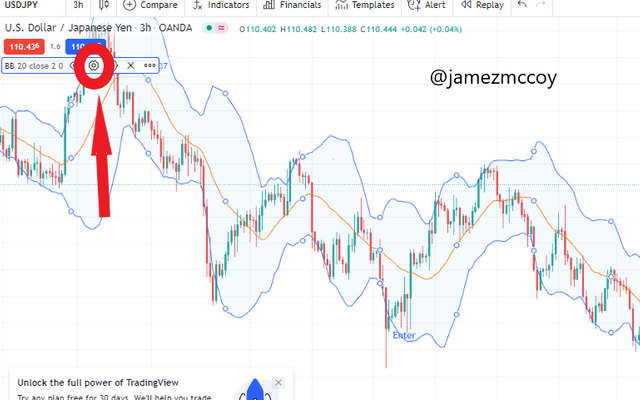
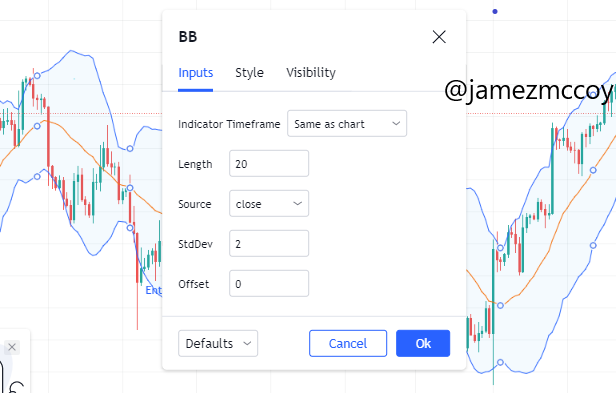
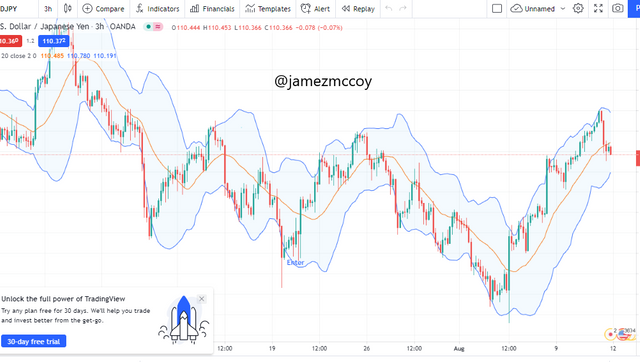
Personally, I enjoy the candles stick chart cause it displays the market opening and closing. After you have selected your preferred type of chart next select an indicator you are most comfortable and familiar with which in my own case is Bolinger bands with the default setting and you can do so by simply clicking the indicator button on the top of the chart and adding your preferred indicator
- Step 3
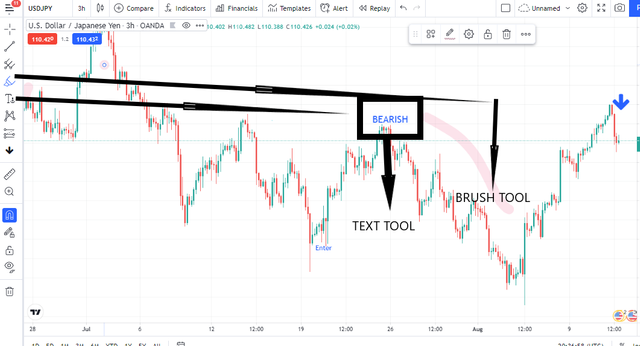
Adding tools
Items found on the most left corner of the tradingView are referred to as tools and they are meant to be used to simplify or ease our understanding of chart and trading analysis
Here I will be making use of the text tool and the Brush Highlighter tool and adding them to my chart for reference and easier understanding of the chart as indicated below
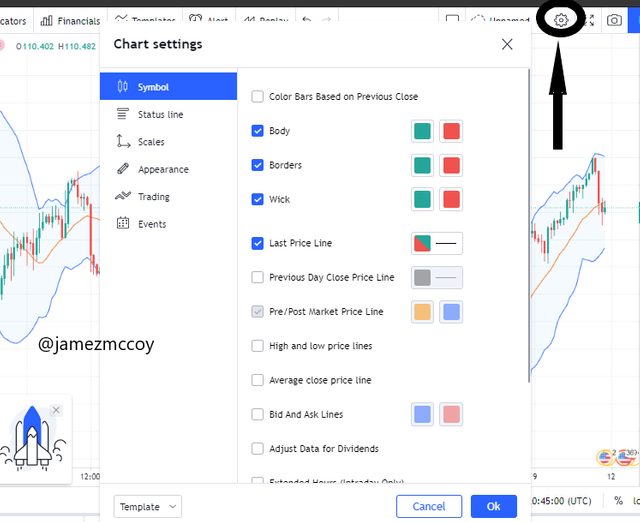
Finally how to edit customize a chart to one's taste which can be done by clicking the setting icon on the top right corner of the chart. In this tab all sorts of colours can be chosen for mine I like to leave it at the dafualt settings cause its usually the customary colours used
Question no 4:
Explain how to add indicator in chart, what is your your favorite indicator and why? (screenshot necessary
An indicator can be added in these few steps
- Step one
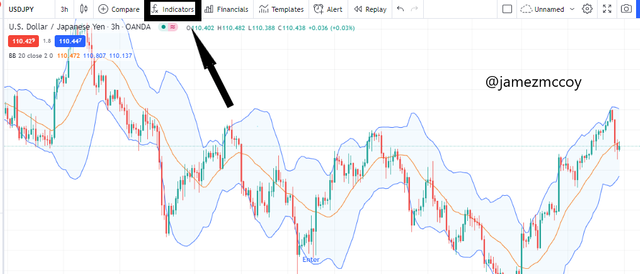
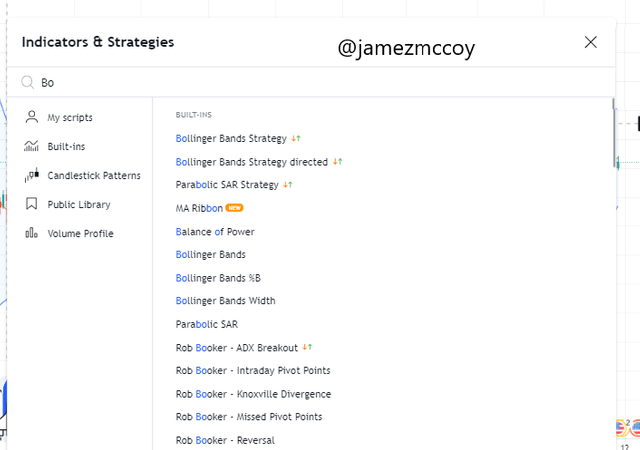
After you have your chart opened click on the indicator as illustrated pictorially below
- Step two
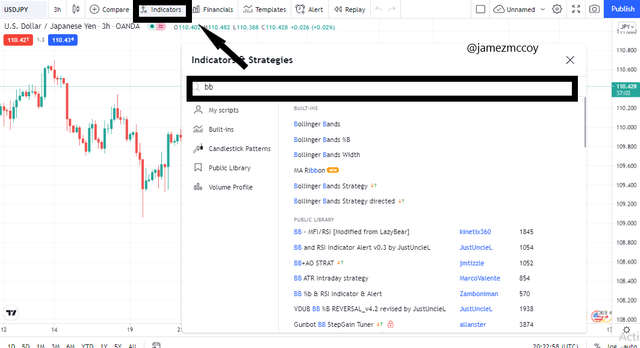
A drop-down list of all indicators on the platform is displayed along with a search bar to help navigate the list. The name of your preferred or chosen indicator should be typed on the search list and selected usually all indicators come with default settings
To tweak an indicators default setting simply click on the settings icon as indicated pictorially below
What is your favorite indicator and why?
The Bollinger Band
Bollinger band is an indicator created by a technical analyst John Bollinger in the 1980s, it uses a moving average that is usually placed in between 2(two) standard deviations which fluctuate according to markets volatility with time and has three notable lines upper band, SMA and lower band..The Bollinger band gives a trader an overview of the market volatility in just a glance if the bands are close or squeezed it indicates high support and resistance which in turn sends trading signals while if the bands are widely apart it indicates high volatility.* In a nutshell the I prefer the Bolingerband because it displays crucial information like volatility at a glance which can help a trader determine trends hence minimize loss
Question no 5:
Do you think TradingView is useful in predicting the market for cryptocurrency (trend / price)?
YES, any form of platform or tool that offers insights or gives information about an asset in the trading world help predict market trends. As a trader they are two know ways one can predict future price or trends movement which are through **TECHNICAL AND FUNDAMENTAL ANALYSIS ** The trading view offers lots of tools, charts and indicators etc. that can be used for technical analysis which is the basic way of predicting a future trend or price of an asset.
CONCLUSION
In the world of trading every bit of knowledge comes off as an edge or an advantage, the more information you have about an asset you are about to trade with or buy the more likely you are to make a good decision or to enter a trade at the right moment, TradingView offers users a wide range of information at just a glance on their finger tips with a very beginner friendly UI for amateur traders. Traders both Professionals and beginners utilize the platform for maximum profit intake and to minimize loss. Thanks a lot professor @yousafharoonkhan for this amazing lecture I hope I was able to answer the questions to your satisfaction. See you all next week
Respected first thank you very much for taking interest in SteemitCryptoAcademy
Season 3 | intermediate course class week 7
respected you explained every point very well, and thank you very much for taking participate in this class,
Thanks professor