Crypto Academy Season 4 , week 2 | Homework post for professor for [@reddileep] : Heikin-Ashi Trading Strategy
.png)
Hello to everyone. Thank you professor @reddileep for choosing such a good homework topic before starting my homework.
It helped me get to know a technique related to the candlestick chart better.
The homework topic for which I will prepare the presentation is Heikin-Ashi Trading Strategy.
Before I start preparing my assignment submission, I would like to briefly talk about the candlestick chart.
In this way, I believe that what I will tell will be better understood by steemers who have no idea about this subject.
.png)
WHAT IS A CANDLE GRAPH?
The chart pattern that shows the lowest, highest, opening and closing values of an asset in a certain time is called a candlestick chart.
Candlestick charts help us stay informed about current trends.
Candlesticks are shown in red on price declines.
Candlesticks are shown in green in price increases.
It consists of parts called body and wick\ntail.
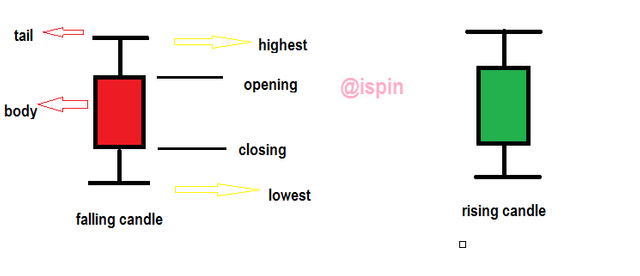
(I edited in paint)
After brief information about the Candlestick Chart, let's explain our homework topic, Hekin-Ashi Trading Strategy.
HEİKİN-ASHİ TRADİNG STRATEGY
1- Define Heikin-Ashi Technique in your own words.
The periods when the markets enter the trend are very important. Because most of the profit and loss happens in this period. Therefore, it is very important to accurately predict the trend period.
Candlestick charts are mostly used to find the trend.
The Heikin-Ashi technique is one of the many techniques used with candlestick charts.
Using this technique in conjunction with a candlestick chart, we try to improve the isolation of trends and predict future prices.
The Heikin Ashi technique is also similar to traditional candlestick charts, but is simpler.
The principle of operation of Heikin - Ashi candles is as follows:
A new candle is formed according to the state of the previous candle.
With the calculation made while the candle is forming, the small movements of the traditional candles are not seen. This makes the graph simpler.
Thus, when we look at the Heikin-Ashi Chart, we can see the trend more clearly.
When creating Heikin - Ashi candles, the previous candles; opening, closing, high and low values are examined and calculations are made. According to this calculation, the next candle is formed.
Small movements in traditional candlestick charts can be misleading for traders. The person may panic.
This avoids panic as these small movements are ignored in the Heikin-Ashi technique.
Also, I would like to say this. If you are using Heikin-Ashi you should make a long term investment. The probability that the price will fluctuate in a short time. But in the long run it will always follow the trend.
We said that we can predict the trend by looking at the Heikin-Ashi candles.
If the candles leave short tails against the direction they are moving, this shows us: There will be a movement in the opposite direction of the candle.
However, it does not give information about how long the movement will take.
Finally, let me say this. If you are viewing a heikin-Ashi chart and see a lot of red candles forming a chain, there is a downtrend here.
If you can see the green candles line up and form a chain, the price is in an uptrend here.
*** If there is a trend, the candles will line up in the same color.
If you are going to trade by examining the Heikin - Ashi candlestick charts, here are the things to consider:
Green or empty candles indicate bullish.
Red or full candles indicate bearish.
Green/blank candles with no wicks/tails at the bottom may indicate the start of a strong uptrend.
Be careful when red or solid candles do not have an overhead shadow. Here we understand that the downtrend is strong.
If there is a change in trend, it is indicated by small body candles and wicks on both sides.
2- Make your own research and differentiate between the traditional candlestick chart and the Heikin-Ashi chart.
Differences Between Traditional Candlestick Charts and Heikin-Ashi Charts
1- In the Heikin - Ashi chart, candles are formed by calculating the values of the previous candle.
In the traditional candlestick chart, candles are formed according to the level at which the previous candle closed.
2- While creating the Heikin-Ashi graph, a formula is used and a mathematical calculation is made.
No calculations are made in traditional candlestick charts. The graph is created with bare numbers.
3- With the mathematical calculations made in the Heikin Ashi chart, small movements are not shown in the candles.
Traditional candlestick charts show all movements.
4- Heikin Ashi graphics are simpler.
Traditional candlestick charts are more complex.
5- Heikin Ashi charts show the trend more clearly than traditional candlestick charts.
Catching the trend is easier on Heikin Ashi charts. It is more difficult in traditional candlestick charts.
3- Explain the Heikin-Ashi Formula. (In addition to simply stating the formula, you should provide a clear explanation about the calculation)
Explain the Heikin-Ashi Formula
The formula is used when creating the Heikin Ashi Chart.
With this formula, price data is calculated and the next candle is created with the result of this calculation.
- Four pieces of data are used when calculating.
1- Opening price
2- Closing price
3- Highest price 4- Lowest price.
These values determine the shape, orientation and size of the candles.
- Open
open = (Previous open + previousclose) \ 2
The opening value of the previous candle and the closing value are added together. The result is divided into two.
Between the open and close of the previous candle, a new candlestick is formed at the middle level.
Close
High
High = The highest value of the recent high, opening or closing value.
The recent highest open or highest close is considered the highest price of the current candle.
The maximum price of the current candle is a high candle.
- Low
Low = The lowest value of the recent low, opening or closing.
The lowest price of the current candle is a Low Candle.
4- Graphically explain trends and buying opportunities through Heikin-Ashi Candles. (Screenshots required)
4- Graphical View of Trends and Buying Opportunities of Heikin-Ashi Candles.
When an uptrend is entered in the market, we see the following on the chart:
- First we see a chain of green candles with no wicks or shadows lined up in a row.
They often have upper wicks instead of lower wicks. The larger the green candle and the higher the wick, the stronger the uptrend of the market will be.
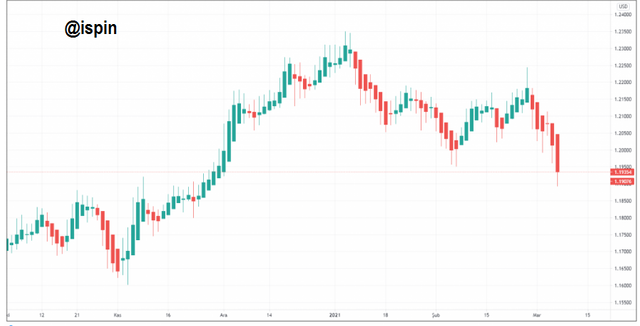
When we examine our chart, we see that there is a clear upward trend from April to mid-May.
I want you to see this too. During this period, the downward wicks are missing.
Candles with almost no body wax and very long wicks are called indecision candles. Indecision candles are very important.
These candles indicate the end of the current trend.
When we see a green candle, we know that this color is bullish. Mostly green color is used for this. However, we need to know that the rise is indicated by a blank candle.
If there is no tail at the bottom of the green or empty candle, we know this: A strong uptrend will begin.
We see this clearly when we examine our graph.
From mid-April, we see green candles with no wicks at the bottom and a strong uptrend is starting.
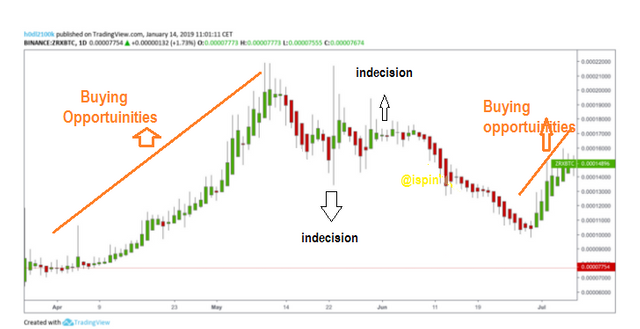
source
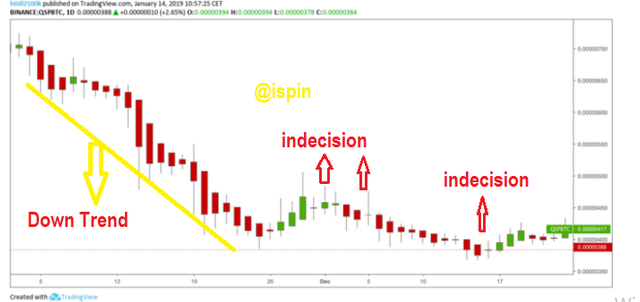
When the market enters a downtrend, we see the following information on the chart:
-If the market is in a downtrend, there is a red candle and this candle has very limited upper wicks or shadows. Candles are arranged in a row. So we see a red candle chain.
The situation is as follows on Heikin Ashi charts where there is a downtrend.
The red candle has only lower wicks. The larger the red candle and the longer the wick extended downward, the stronger the higher uptrend will be seen in the market. .
When we examine our chart, we see that the lower wicks are getting longer in the red chain candles that are listed as of the 12th of the month. This shows us that the downtrend will continue.
On our chart, we see an indecision candle on the 26th and a short bullish one is visible. Later, we see another indecision candle and the downtrend is entered again.
With Heikin Ashi Charts, you can find the downtrend and uptrends with these explanations. You can make good profits by buying without going into an uptrend.
An indecision candle after a downtrend may herald an uptrend and this point can be a good buy point.
Likewise, an unprofitable candle seen after an uptrend may herald the start of a downtrend. Might be a good spot to sell.
5- Is it possible to transact only with signals received using the Heikin-Ashi Technique? Explain the reasons for your answer.
The Heikin Ash Technique is an excellent technique to catch the trend of the market. Thanks to its formula, it reduces the noise of the market and shows the trend direction better than traditional candlestick charts. However, no technique is sufficient on its own.
In addition, the loss of price data with the average as a result of the calculation may pose a risk.
Of course, the signals received with this technique should be evaluated, but we should not only act accordingly.
It may also be suitable for long-term traders, but not suitable for short-term traders.
It hides important price information because average data is used.
Daily closing prices are important for many buyers and sellers. However, we cannot see the actual daily closing price on the Heikin-Ashi chart.
Do not use this technique, especially if you are going to trade for a short time in a market that is very volatile, such as the crypto world.
Don't forget to use a few techniques together, although it shows trends more clearly for long-term trades.
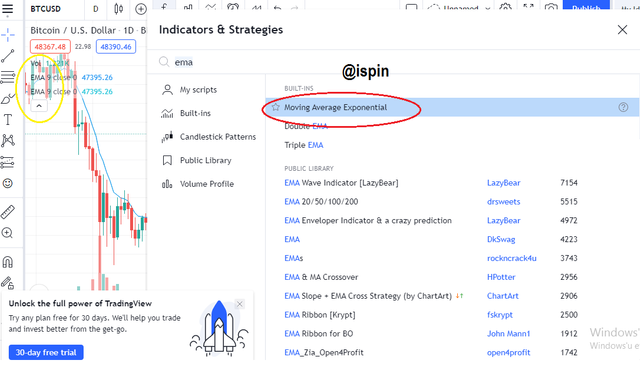
6- By using a Demo account, perform both Buy and Sell orders using Heikin-Ashi+ 55 EMA+21 EMA.
Using the Heikin-Ashi+ 55 EMA+21 EMA, I performed the following steps to execute both Buy order.
- https://www.tradingview.comscreenshothttps://tradingview.com taken by
I logged into the site.
I chose BTCUSD coin to buy.
I added the EMA technique to its chart.
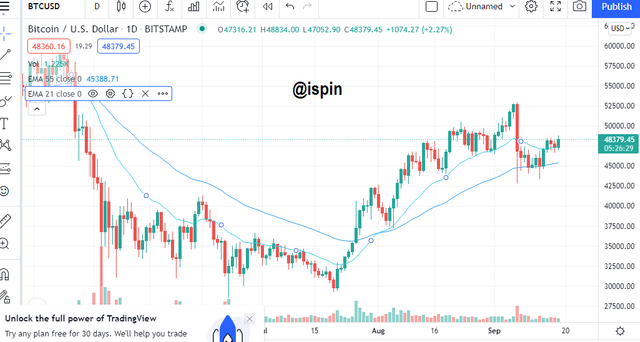
If the market is unstable and a strong bullish candle opens, it may herald an uptrend.
I've looked at the non-strong bearish candles here. Later, I saw the undecided candle, which gave a bullish signal, as a harbinger of a buying trend. Also, EMA21 could be a support point.
Therefore, I opened the point I indicated with a yellow sign on the screen for purchase.
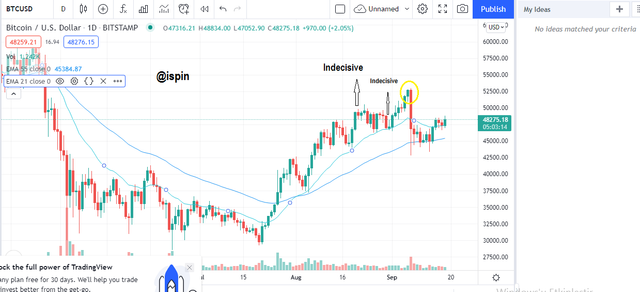
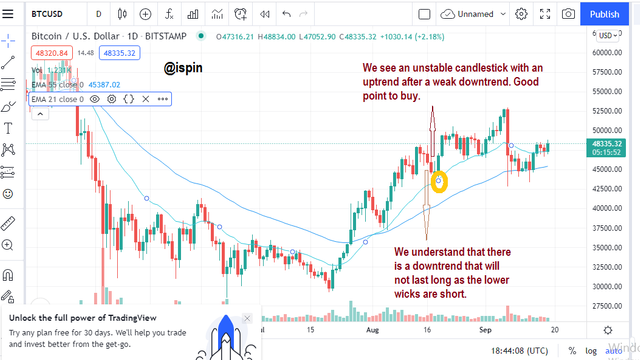
The market fluctuated and the number of undecided candles increased.
The upper wicks were short on the last bullish candles, indicating that the bullish is about to end.
Also, the lower tail of the bearish candle was quite long.
At this point, I thought the downtrend would start and I placed a sell order at the yellow spot I marked.
RESULTS
Knowing market trends is very important for traders.
They can avoid making losses by following the trend.
One of the methods that shows the trends most clearly is the Heikin-Ashi technique.
However, it should be noted that no single technique is sufficient on its own.
Thanks to Professor @reddileep who helped me learn this Technique.
Başarılar dilerim canım harika gidiyorsun 🤗 Her ne kadar borsanın içerisinde olsam da bana bu ödevler bayağı bayağı bir zor geldi. Gerçekten yemek verip uğraşıyorsun. Seni tebrik ederim.😍
Teşekkür ederim. Biraz zorlayıcı oluyor. Ancak öğrendiğim şeyler hoşuma da gidiyor.
Ben de dişim göre bir ödev bulursam yapmaya çalışacağım. Ödevleri okuyarak bile bazı şeyleri daha iyi anlıyorum. özellikle alım-satım ve trade ile uğraşan kişiler için gerçekten faydalı. Benim de bu ödevleri çalışıp yapmam gerekiyor aslında. Ben alım satım işlemleri yapıyorum ama işin inceliklerini bilmediğim için pek kar edemiyorum traid yaparken. 🙈
Kesinlikle çok faydalı şeyler var canım . Fırsat bulursan yap mutlaka. Hem de alım satım yaparken daha fazla kazanırsın
İnşallah canım 🙏
this work is very successful😊😊
Teşekkürler ☺️