CRYPTO ACADEMY WEEK 10 - HOMEWORK POST FOR @stream4u: ALL ABOUT PRICE FORECASTING: BY@hydra1
![]()
Greetings everyone here
I’m glad to take part in Steemit Crypto Academy Season 2 , we are in now in the 10th Week of Steemit Crypto Academy, It begun with exciting lecture from professor @stream4u . I’m grateful to be part of this session, thanks to Professor @stream4u
Professor gave a comprehensive lecture on price forecasting, the three various types of price forecasting analysis and the methods used in price forecasting. It further explained how to do price forecasting with series of examples illustrated and also why price forecasting is needed.
Haven’t gone through the lecture of the 10th week of Steemit Crypto Academy, It’s my wish to participate in the home work of the Steemit Crypto Academy Season 2, 10th week.
What Is Price Forcasting?
Price is known to be a said amount of money that has to be paid to acquire a given product or services and forecasting is as well the process of making predictions using past or presence data and mostly by analysis of trend.
Price forecasting is simply understood as predicting the price (monetary value) of goods and services in the future. There can be price forecast on the block chain market on either it will appreciate or depreciate examples like BitGive, Bitcoin, Circle, Spotify and many other more. Price forecasting can also be used in various currencies on platforms like Forex Trading.
Why is Price forcasting Needed
One may ask why price forecasting is needed, in this instance, I will like to talk about the importance or role it plays.
At the base level, an accurate forecast can keep prices low by optimizing a business operation-cash flow, production, staff and financial management.
It also aids in reducing consumer volatility and anticipating change, as well as improving internal communication. Price forecasting can’t be treated like gambling where it is left in the hands of luck, if you have to gamble you must do so under certain principles and techniques.
Price forecasting gives an opportunity to employ some various types of analysis on how to understand price/market trend, chat pattern and its movement, market support and many more to be able to make accurate informed decision on the price.
What Method are the best you feel for price Prediction/Forecasting
Basically there are three types of price prediction /Forcasting methods that are used on daily basis to predict the price of an asset and i will like to talk about all three and as well justify as to which method i feel is best.
Technical Method:
Technical Method: This tool primarily relies on past and current market indicators of the commodity to assess whether an asset's price action is bearish or bullish, market dynamics, product support and resistance, entry and exit points, and other product characteristics. When all of these factors are taken into account, the price behavior of the assets is determined.Fundamental Method: fundamental uses the performance and not current market trend to decide on the prediction of price. Investors often examine the product's long-term strategy by consulting the whitepaper, which invariably outlines the product's roadmap. The profitability of the company launching this product, as it affects its financial position and capacity to produce all deliverables needed to make the product bullish, are other information that an investor would consider.
Sentimental Method: Sentimental analysis is made using the volatility in the market. A trader uses forums such as news, social media and many more avenues, in this instance, such news brings panic and fear and these traders try to take advantage of it, as these sentiments are certain or not , they come with Consequences either a gain in profit or a loss is made due to the quick movement of the market.
Justification on which method is best
Price forecasting helps in short-term investment and long-term investment as well. Time is also taken to study the volatility in the market before deciding on the price prediction.
It’s also important and needed because after all the various forms of analysis it gives the trader adequate knowledge to decide on either to sell or hold.
In the best way to I feel to adopt as a method for price forecasting will be the technical analysis.
In reference to the lecture given, Technical analysis can help in trading and investment, how to identify the market trend that’s to say you check on the previous data of the market trend, price movement of both past and presence, chart pattern, bearish-bullish trend, market support, considering all these points, a Technical analyst predict assets price.
This to me seeks to give accurate, informed, best price forecasting if it’s chosen as the preferred method.
Illustration of P rice Forcasting with Technical Analysis
Screenshot
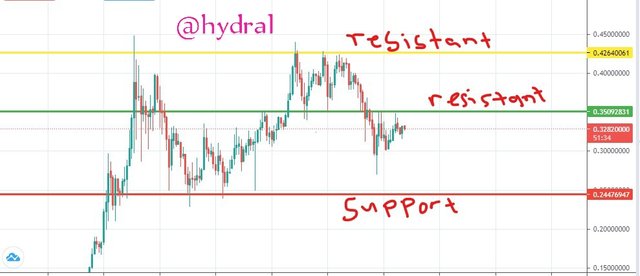
A weekly chart of the doge coin can be seen in the screenshot above.
On the chart, there are three line indicators: red at the bottom, which is called support, green in the center, which is called resistance, and yellow at the top, which is also called resistance line.
First and foremost, in a crypto or forex chart, the market goes up and down. If one examines the chart at price $0.2447 at the support line, most of the candle sticks wanted to penetrate the support line to the bottom, but whenever they did, they rejected it and went up, indicating that there is a support there and that because it was unable to break to the bottom, it has now changed direction to the up.
One can see that a price of $0.2447 has been rejected several times there, and the wigs of the candles have shaped patterns there, and they are all on the same level at that stage, indicating that it attempted but failed to break it to the bottom.
When looking at the resistance line, specifically the green line, which is currently $0.03509, it can be seen that the wig of the candle tried to penetrate through the green line, but once it got to that price, it was rejected and came down to $0.3282, indicating that the price is being resistant there and therefore preventing the market from breaking through the green line.
The yellow line, also known as resistance, can also be seen on the chart at $0.4264.
When the price reaches that level, it will drop. When the price crosses a resistance to the top of the line, it means the resistance has become a help.
If you look at the support line on the far left, it crossed from that stage to the top; note, before it could do that, it was a resistance; you can see that it tried to go through but couldn't, so it came down. As a result, it was finally able to break through to the top and become a support.
Screenshot
Screenshot
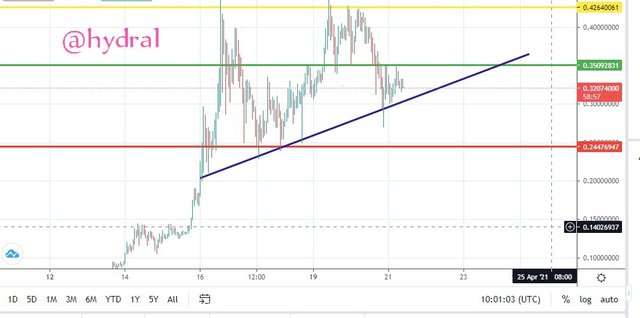
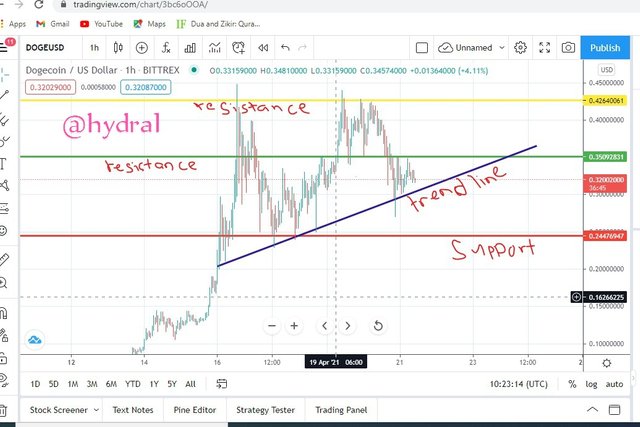
With the entry, we can draw a trendline( the blue line) and we notice that the trend is uptrend.so we can wait till the price is rejected at the trendline then we go in for long(buy).
Again, we can also wait till we get a daily close above the resistance at price $0.35092831 then we go in for long(buy)
Lastly we can wait for the price to get rejected at the support level of $0.24476947 and then we buy
we can set our take profit at each resistance level since price is likely to get rejected at that level.
so we can set our take profit a little below the top most resistance at price $0.4264006.
Because price is likely to get rejected at that level, but in case the price breaks through to the top, in order words if it doesn't get rejected it will go up.
Thank You
Cc:
@stream4u
Hi @hydra1
Thank you for joining The Steemit Crypto Academy Courses and participated in the Week 10 Homework Task.
Your Week 10 Homework Task verification has been done by @Stream4u, hope you have enjoyed and learned something new.
Thank You.
@stream4u
Crypto Professors : Steemit Crypto Academy