Crypto Academy Week 5 Homework Post for @stream4u, The Supertrend Indicator
Professor @stream4u has asked to make a homework task for his week 5 Post on the below Topics:
What Is A SuperTrend Indicator?
Show how to set SuperTrend on Chart and what are its settings need to configure.(Screenshot Needed)
How SuperTrend Shows Buy-Sell Indications? (Screenshot Needed)
When We can place a Buy Trade with the help of SuperTrend Indicator? (Screenshot Needed)
When we can place exit/square off, sell order with the help of SuperTrend Indicator? (Screenshot Needed)
How false indications look in SuperTrend Indicator? (Screenshot Needed)
According to your view what Stoploss you will suggest?
Conclusion.

What is Supertrend Indicator? Screenshot: TradingView Chart
The Supertrend Indicator
What exactly is a supertrend indicator? It's like the moving average analysis, it's also a trend direction overlay used in technical analysis charts. Using this indicator, we can objectively find the state of the market and will help us in making our trades.
This kind of indicator is used to gather signals for buying and selling cryptocurrencies. It works well when there's a clear trend in the market (bullish or bearish), but if the trend is ranging (sideways) it may give false signals that we need to be aware of.

Tradingview chart, using STEEM/BTC market/chart. Screenshot: TradingView Chart
Using Tradingview.com, we can easily use the Supertrend indicator by looking it up inside the Indicators listing. Take note there are many variations there, so to be safe just use the one with the highest number on it.
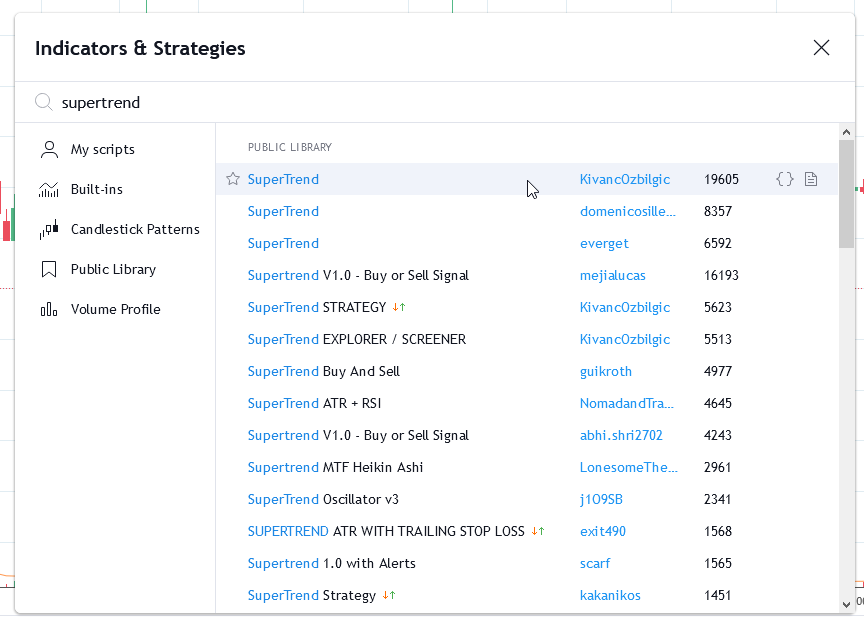
List of Indicators and Strategies in TradingView. Screenshot: TradingView Chart
Once you have activated the indicator, it will show up as a menu where you can look for the settings button to make adjustments on the indicator.

Adjusting settings for supertrend indicator in TradingView. Screenshot: TradingView Chart
Clicking on the settings button will give you a pop-up window inside the page where you can change a lot of things:

Adjusting settings/input for supertrend indicator in TradingView. Screenshot: TradingView Chart
The main thing you need to look at on that menu is the "ATR Period" and the "ATR Multiplier". By default, the Supertrend indicator I used has the 10,3 setting used for the short term. The typical long-term setting will be 30,9.

Settings/input for supertrend long-term indicator (30,9). Screenshot: TradingView Chart
Buying and selling signals are generated with Supertrend when the indicator starts plotting either on top of the closing price or if it's below the closing price.

Quick look at a supertrend overlaid on a TradingView chart. Screenshot: TradingView Chart
Buying signals are generated when the Supertrend closes above the price and selling signals are generated when it closes below the closing price.
If someone is going to ask when will a Supertrend indicator tell us to buy? It's actually very simple, especially in TradingView. The Supertrend will actually tell you, literally, as seen in these different Supertrend Indicator variants:

A supertrend variant in TradingView. Uses Buy/Sell labels. Screenshot: TradingView Chart

A supertrend variant in TradingView. Uses Short/Long labels. Screenshot: TradingView Chart

A supertrend variant in TradingView. Uses arrow labels. Screenshot: TradingView Chart
The same is true on when to sell using the same variants. They will have arrows pointing to the place, or even the words SELL.
Although, as mentioned above, there are instances where the trend may give false buy and sell signals especially on sideways moving markets. For example:

A supertrend overlay in TradingView. Sample on where to buy/sell. Screenshot: TradingView Chart
If you look at this, the up and down movement isn't that wide so we can't really say it's a bearish or a bullish market. The movement is sideways. If you follow the sell signal in this chart - you will see that the prices eventually go up. In a clear market trend - if the signal says sell, then the price should continually go down until it reverses into a buy signal.
For selling using this indicator/method, I suggest using a trailing stop loss. The percentage will depend on your risk appetite.
If you put a 10% trailing stop loss then the sell trade will be issued if the price drops 10% from its peak price after you did the purchase. Here's an example:
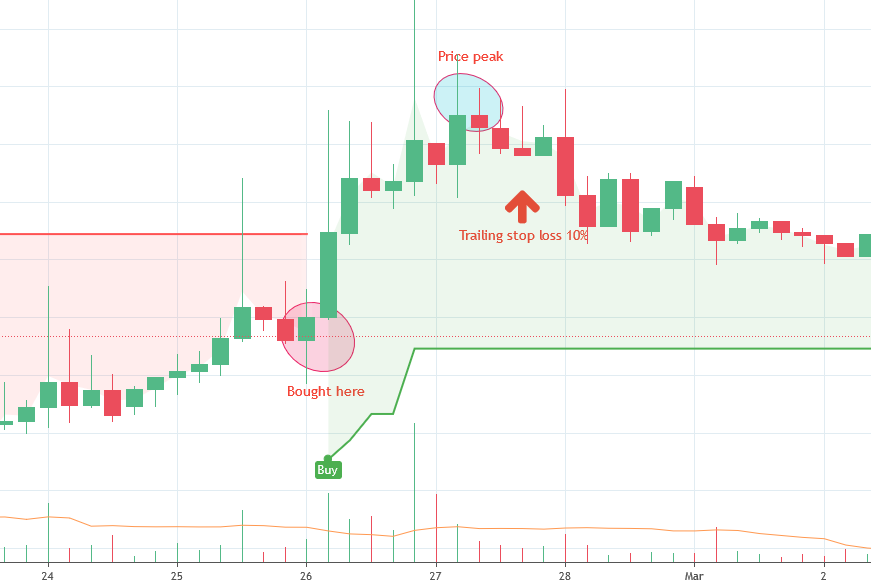
Placing a stop loss based on the buy and sell signals. Screenshot: TradingView Chart
Let's use this example, the red circle is where you bought in (let's say at 0.00000779 sats), then you will set a stop loss trailing at 10%. This chart shows the peak at 0.0000977 sats before the price went down. If it continuously goes down, there will be a difference of 0.00000200 sats between the purchase price and the peak, which means our stop loss will be triggered when the price goes down to 0.00000957 sats.
Conclusion

Conclusion graphic. Screenshot: TradingView Chart
I would clearly say that Supertrend Indicators are indeed very useful to cryptocurrency traders who are looking to maximize profits and minimize their risks in trading. It is also wonderful how the indicator options in tradingview have different looks you can choose from to suit how you understand it.
Gracias!
I sure hope you had more knowledge about this topic I presented in this post of mine.
Thanks to @stream4u for this homework task. Shoutout to @steemitblog, @steemcurator02, and @steemcurator01 for this chance too.
I have enjoyed this learning experience, I'm already looking forward to @stream4u's 6th-week homework task!
Hi @haneun
Thank you for joining Steemit Crypto Academy and participated in the Homework Task 5.
Your Homework task 5 verification has been done by @Stream4u.
I wanted to highlight one point again regarding BUY which has also mentioned in the course, below is the same.
We can see in this how the price tuches the line and moved up, so buy at this support line, this is for safe trade.
Thank You.
@stream4u
Crypto Professors : Steemit Crypto Academy
Thanks a lot professor!