SEC S18-W1 || Mastering the Markets with technical analysis
Hello everyone I hope you all are good and enjoying your life. I am really happy to join the Mastering the Markets A Technical Analysis Challenge. I love trading and want to get better at it. This contest is great way to learn more about how to read market data and try my trading idea. I am not an expert in trading but I am learning it from Crypto Academy. Trading is a mix of art and science and I find it very interesting. But I know there always more to learn. This challenge is a great chance to improve my skills meet other traders and get better. I am excited for the weekly tasks. They will help me understand technical analysis better and learn more about how financial markets work. Being part of this community will be great Experience and help me grow as trader.
The Importance of Technical Knowledge in Trading |
|---|
Having technical knowledge in trading is really important. It helps me understand market behavior and makes better trading decisions based on how price have moved in the past. Instead of looking at company financial health like in fundamental analysis technical analysis focuses on patterns and trends in trading activity.
Key Components of Technical Analysis
1. Price Charts:
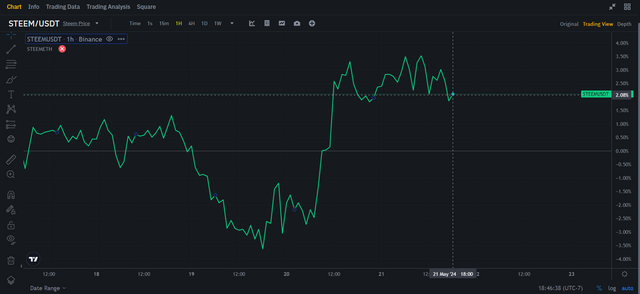
- Line Chart: This chart show only the close prices over a period of time. Its simple and helps me see the overall trend of the market. For example if I am looking at a line chart for STEEM/USDT over the last hour and it shows a 2.75% increase I can quickly understand how the price has change recently.
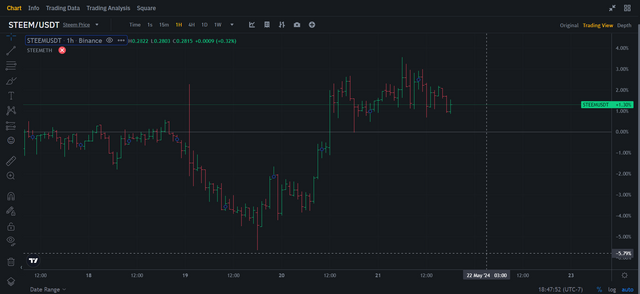
- Bar Chart: A bar chart provides more detail. It show the opening high low and closing price for each period. This helps me understand how much the price move within each hour.
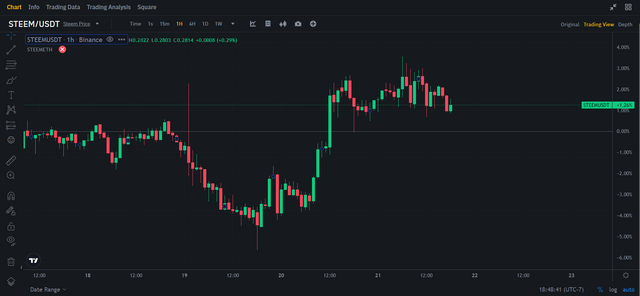
- Candlestick Chart: This is similar to bar chart but more visual. Each "candlestick" show the opening high low and closing prices. The body of the candlestick show the range between the opening and closing Prices and the wick show the highs and low. This helps me see patterns more clearly.
2. Indicators and Oscillators:
- Moving Averages: These help smoth out price data to show the trend. for example 50 hour moving average show the average closing price over the Last 50 hours helping me see the trend directiond.
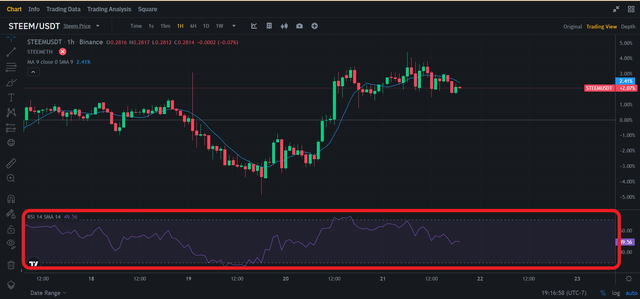
- Relative strength Index: RSI measure how fast and how much price changed. It help me see if stock is overbought (too high) or over sold (too low). If RSI is aboved 70 the stocks might be over bought if its below 30 it Might be over sold.
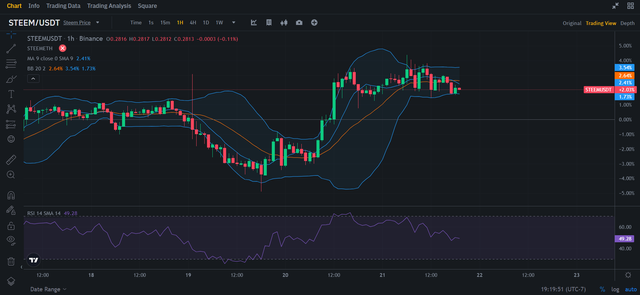
- Bollinger Band: These are line drawn above and belows moving average showing the volatility of the stocks. If price touch the upper band the stock mighted be overbought and if they touch the lower band it might be over sold.
3. Trend Lines and Chart Patterns:
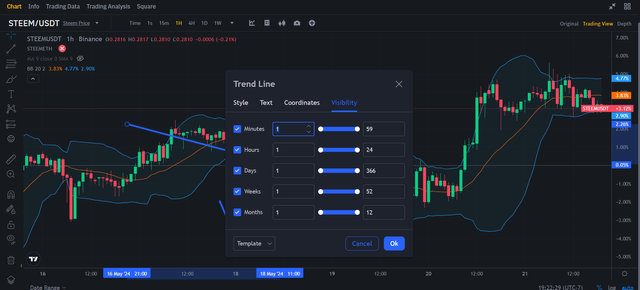
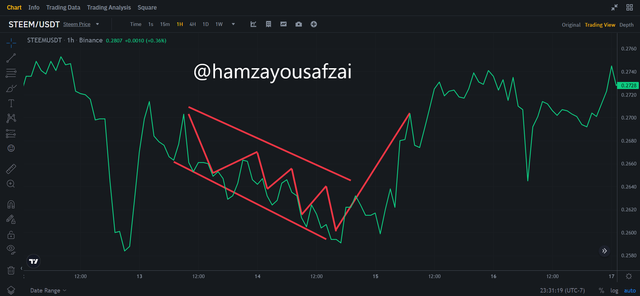
- Trend Lines: These are lines I draw on a chart to connect prices. They help me see the direction of the trend. For example an upward trend line shows that the stock is generally moving up.
Support and Resistance Level: These are horizontally line at price where the Stock tend to stop and Reverse. Support is lower Level where the price tend to stop falling and resistance is an upper level Where the price tends to stop rising. Knowing these levels help me Decide where to buy or selling.
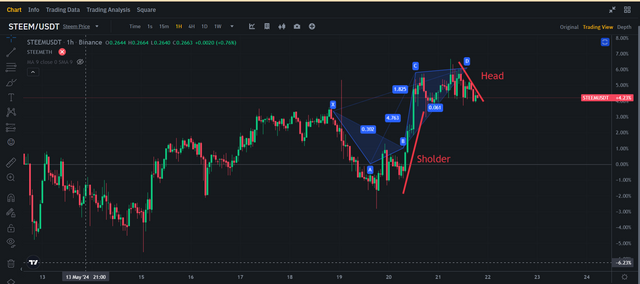
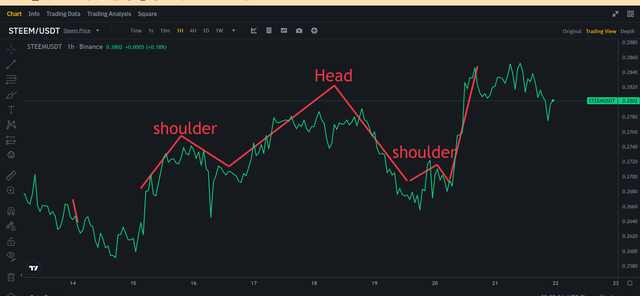
Chart Patterns: These are shapes that price make on chart which can predct future movements. For example a "Head and Shoulders" pattern can signal reversal in the trends.
4. Volume Analysis:
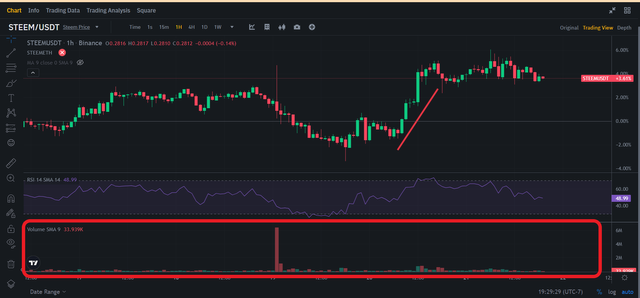
- Volume: This is the number of share traded. High volume mean lot of interested in the stock confirming trends. For example if stock price rises on high volume its strong signal that the trend mights continues.
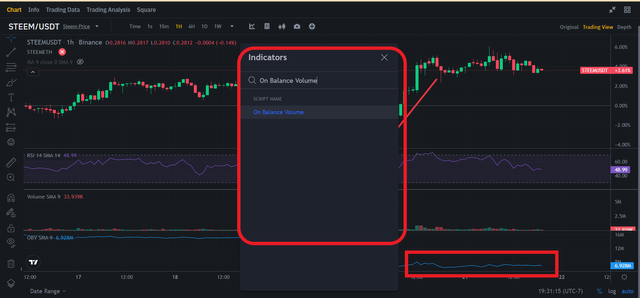
- On Balance Volume: This adds volume on up day and subtract volume on down day. If OBV is rising it suggests that buying pressure is higher than selling Pressure.
Information Gathered from a Technical Chart
- Trend Direction: Charts help me see if the market is going up down or sideways. This helps me decide whether to buy sell or hold.
- Market Momentum: Indicator like MACD and RSI shows how strong the curent trendz is and if it might changed directions.
- Support and Resistance Levels: These levels help me find the best price to buy or sell. For example if a stock is near its support level it might be a good time to buy.
- Volatility: Tools like Bollinger Band show how much the price is moving helping me understand the risk.
- Market Sentiment: Patterns and volume analysis help me understand the overall mood of the market. For example high volume on price rise shows strong positive sentiment.
How to Read Cand lestick Charts and the Significance of Different Time Frame in Trading |
|---|
Cand lestick charts are likes map for traders showing how prices move over time. They are colorful and easy to read once you understand them. Here how I see it
1. Understanding Candlestick Components:
- Body: The colored part of the candlestick. If its green it means the price went up during that time. If its red it means the price went down.
- Wicks: The lines sticking out of the top and bottom of the body. They show the highest and lowest price Reached during that time.
2. Making Sense of Candlestick Patterns:
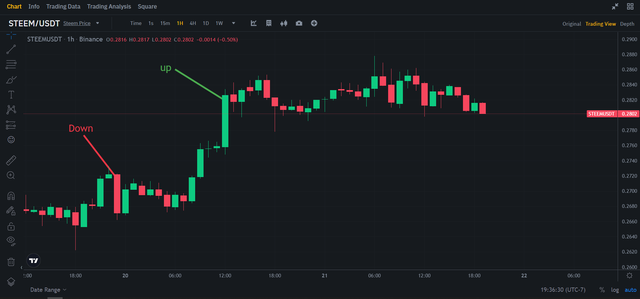
- Bullish Patterns: These patterns show potential for prices to go up. For instance if I see big green candlestick following a small red one it might mean the price will keep going up.
- Bearish Patterns: These patterns suggest prices might go down. If there big red candlestick after small green one it could mean a downward trend.
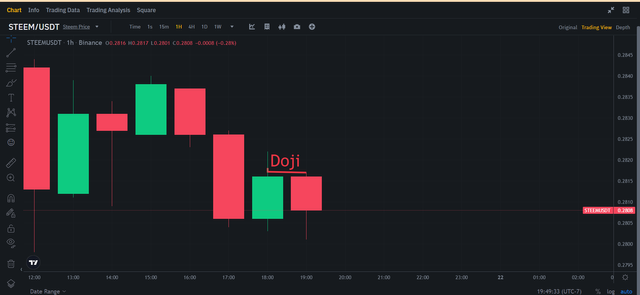
- Doji: When the opening and closing price are almost the same it shows uncertainte in the market. Its like pause button in trading.
- Hammer and Hanging Man: These look like Well hammers or People hanging. A hammer at the bottom of a chart might mean the price will go up While a hanging man at the top could signal a drop.
3. Looking at Different Time Frames:
- Short Term (Intraday): These are for quick trades during the day like buying and selling within minutes or hour.
- Medium Term (Swing Trading): These time frames cover few days to week. They help me catch bigger price swings.
- Long Term (Position Trading): This is for the big picture holding onto trades for weeks months or Even years.
4. Why Multiple Time Frames Matter:
- Confirmation: Checking different time frames helps confirm if a pattern is real. If I see bullish pattern on a short term chart and a long term one its more likely to be accurate.
- Context: Big trends on long term chart give context to smaller moves on short term charts. For example short term downtrend might not matter much if the long term trend is up.
- Trading Signals: sometime different time frames give mixed signals. Its likes hearing two different weather forecasts. I have to decide Which one to trusted based on What I see and my trading Plan.
By using candlestick chart and considerng different time frames I can Navigate the market with more confidence. Its likes having roadmap to guide me through the twist and turn of trading
Understanding Chart Patterns |
|---|
Chart patterns are like footprints left by the market telling story about where prices might go next. Here how I see them:
What Are Chart Patterns?
Chart patterns are shape or formation that appear on price chart. They are create by the movements of buyers and sellers in the market. These pattern can give clues about future price movement.
Differentiating Continuation Patterns and Reversal Patterns
1. Continuation Patterns:
- These patterns suggest that the ongoing trend is likely to continue after brief pause.
- Examples include flags pennants and triangle.
- For instance if a stock has been going up and then it forms flag pattern it could mean the uptrend will resume after short consolidation period.
2. Reversal Patterns:
- These pattern indicate that the current trend is likely to revrse direction.
- Examples include head shoulders double tops and double bottom.
- For example if stock has been in downtrend and then forms double bottom pattern it might signal trend reversal and the start of Uptrend.
Utilizing Chart Patterns for Effective Stop Loss Order
Stop loss order are like safety net for traders protected them from big loses if the market moves against their Position. Here how I use chart pattern to set effective stop loss order
Identifying Key Levels: Chart pattern often form around key support and resistance levels. These levels act barriers that prices have difficulty breaking through.
- For Long Trades: I place my stop-loss orders below key support level. If prices break below these levels it could signal trend reversal and I want to exit the trade to limit losses.
- For Short Trades: I place my stop-loss orders above key resistance levels. If prices break above these level it could indicate that the trend is reversing and I want to exit the trade to minimize losses.
Using Pattern Confirmation: I wait for confirmation that the chart pattern is Valid before setting my stop losses orders. This could be in the form of break out (for contnuation patterns) or pattern completion (for reversal patterns).
- For Continuation Patterns: I set my stop los order just below the pattern low (for long trades) or above the patterns high (for short trades).
- For Reversal Pattern: I set my stoped loss order just beyond the pattersneck line ( for head and shoulders ) or above the pattern high ( for double tops) and belows the Patterns low ( for double bottom ).
Adjusting Based on Volatility: I take into account the volatilty of the market when setting stop loss order. If the Market is highly volatile I might set wider stop loss orders to avoid being prematurely stop out by minor price fluctuation.
By using chart patern to guide my stop los Placement I can manage my risked Effectively and protected my trads capital from signifcant losses. Its like having safety plan in place before going on journey it help me stay safe Even if things don not go Expected
What is TradingView and How Can It Be Used in Real time Trading? |
|---|
TradingView is amazing tool that helps me analyze the markets and make better trad decision. It offer lot of features that are very helpful for both beginner and experience trader.
Using TradingView
1. Charting Tools:
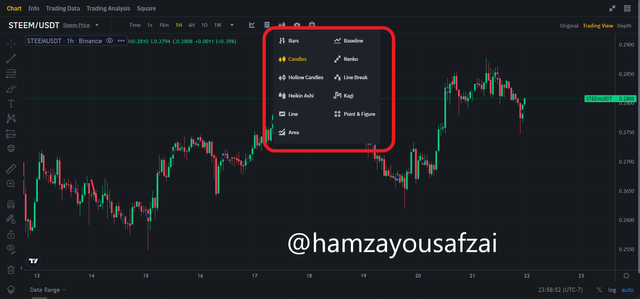
- Interactive Charts: TradingView has charts that I can Customize easily. I can choose different types of chart like line bar or candlestick charts and adjust the time frame to see how prices move over different periods.
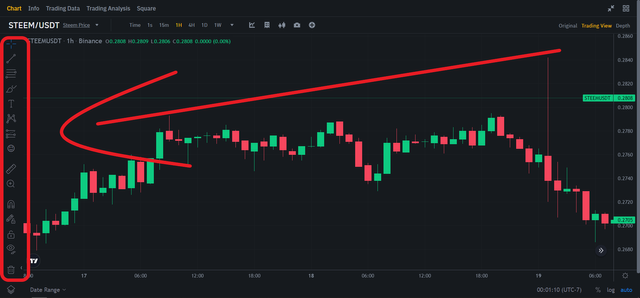
- Drawing Tools: There are many drawing tool Such as trend lines rectangle and Fibonacci retracements. These help me marks important price level and identify pattern.
2. Technical Indicators:
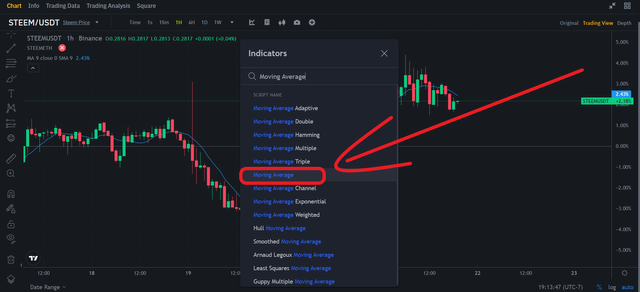
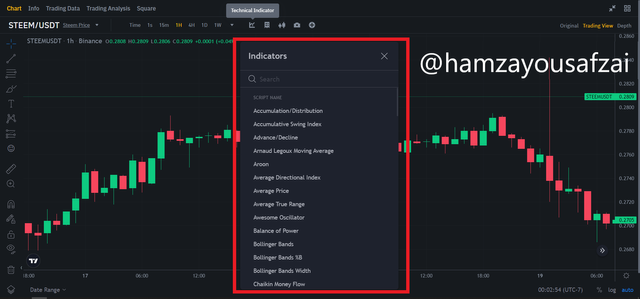
Built in Indicators: Trading View offer awide range of built in indicator likes Moving average RSI MACD and Bollinger Bands. These indicator help me understand market trends and potential turning points.
Custom Indicators: If I want something more specific I can created my own indicators using Pine script which is TradingView Programming Language This allow for Advanced customization.
Real Time Data: TradingView provide real time market data Which mean I can apply these indicator and see the results immediately the market move.
3. Alerts and Notifications:
- Price Alerts: I can set alerts for specific price level. For example if I want to know when Bitcoin reache $30 000 I can set alert and get notified instantly.
- Indicator Alerts: I can also create alert based on technical indicators. For example I can set alert for when the RSI goes above 70 indicating that asset might be overbought.
4. Social Community:
- Sharing Ideas: TradingView has a community of trader who share their analysis and ideas. I can learn from others follows experienced trader and get feedback on my own trading ideas.
- Collaboration: Engaging with other trader help me see different perspective and improved my strategie.
Relationship Between Support & Resistance Level
Support and Resistance are key concepts that help me understand Where the price of an asset might stop and reverse directions.
1. Support Level:
- Definition: A support level is price point Where the price tend to stop faling and bounce back up . Its like floor that support the Price.
- Example: If stock has repeatedly bounced back up Whenever it hits $50 then $50 is considered a support level.
2. Resistance Level:
- Definition: A resistance level is price point where the price tends to stop rising and drop back down. Its like a ceiling that the price struggles to break through.
- Example: If stock has repeatedly fallen back down whenever it reach $100 then $100 is considered resistance level.
How Technical Indicators Help Understand Support and Resistance
Technical indicators are tool that help me identify and confirm support and resistance level making my trading decision more reliable.
1. Moving Averages:
- How It Helps: Moving averages smooth out price data to show the average price over certain period. They often act dynamic support and resistance level.
- Example: If stock consistently finds support at it 50 day moving averaged during a pullback it might be good time to buy When the Price touched this moving averages.
2. Relative Strength Index (RSI):
- How It Helps: RSI measures how fast and how Much price are changing. It help me saw if asset is Overbought ( above 70) or Oversold ( below 30).
- Example: If the RSI fall below 30 indicat the asset is oversold the Price might find supports and start to rised.
3. Bollinger Bands:
- How It Helps: Bollinger Bands are lines plotted above and below moving average showing the volatility. Prices tend to stay Within these bands often bouncing off them.
- Example: If the price of an asset touches the lower Bollinger Band it might indicate support level suggesting potential buying Opportunity.
4. Volume Indicators:
- How It Helps: Volume indicators Show the amount of trading activity. High volume near support or resistance levels confirms the strength of these level.
- Example: If a stock approaches known resistance level with decreasing volume it might struggle to break through suggesting a potential sell signal.
Using Chart Patterns for Effective Stop Loss Orders
Stop loss orders help protect me from big losses by Automatically selling asset if its price falls to certain level. Here how I use chart patterns to set them
Identifying Key Levels: Chart patterns often form around key supports and resistance levels. I place my stop loss orders just below support levels for long trades or just above resistance levels for short trades.
- Example: If I buy a stock at $50 and See support at $48 I might set my stop loss order at $47 to limit my loss if the price drops below support.
Using Pattern Confirmation: I wait for Confirmation that pattern is valid before setting my stop loss order.
- Example: For a head and shoulders pattern I might set my stop loss just below the neckline if I am going long or just above it if I am going short.
Adjusting Based on Volatility: I consider the markets volatility when setting stop loss order. Wider stop losses might be Necessary in highly volatile market to Avoid being stop out by minor price swing.
By using TradingView to applied technical indicator and analyzed support and resistance level I can make more informed and confident trading decision. This helps me navigate the market more effectively and protect my investments.
Utilizing Pivot Points in My Trading Journey with Real-Time Steem Coin Price |
|---|
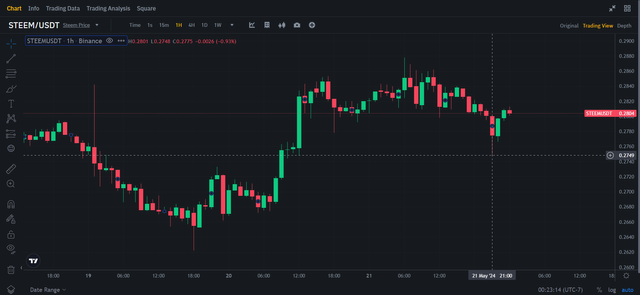
As I navigate the markets pivot points have become an integral part of my trading strategy helping me to identify potential support and resistance level for various assets including Steem coin. Lets do how I configure and trade with pivot point incorporating real-time data
Calculation of Pivot Points for Steem Coin:
Pivot Point (P):
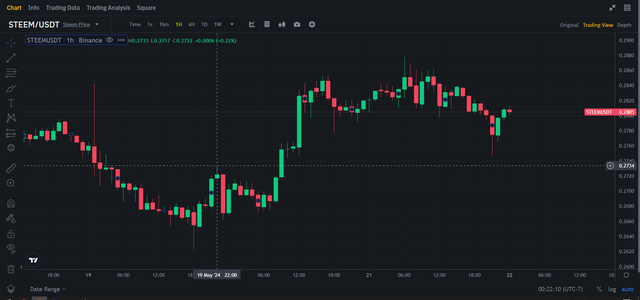
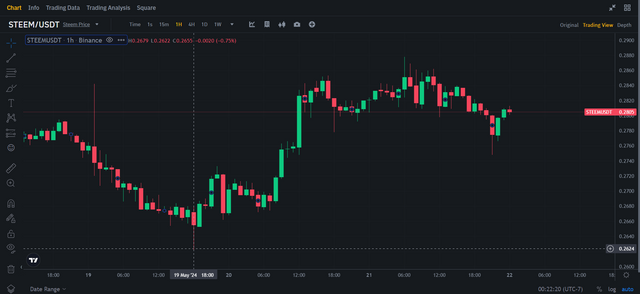
( P = \frac{High + Low + Close}{3} )On 19 may 2024
High Price = 0.2734 USDT
Low Price = 0.2622 USDT
( P = \frac{0.2734 + 0.2622}{2} )
( P = \frac{0.5356}{2} )
( P = 0.2678 )
- Support and Resistance Levels:
First Level Support (S1):
( S1 = 2P - High )
( S1 = 2(0.2678) - 0.2734 )
( S1 = 0.5356 - 0.2734 )
( S1 = 0.2622 )First Level Resistance (R1):
( R1 = 2P - Low )
( R1 = 2(0.2678) - 0.2622 )
( R1 = 0.5356 - 0.2622 )
( R1 = 0.2734 )
Trading with Pivot Points:
Pivot Point Bounce:
- Based on the calculated pivot point I can looked for potential buying opportunity near the first support level (S1 ) and selling opportunities near the first resistance Level (R1).
- If the price of Steem coin approaches 0.2622 USDT I may consider entering long position expecting bounced back up
Pivot Point Breakout:
- A breakout strategy involve entering trades When the price breaks above or below pivot point Level.
- If the price of Steem coin breaks aboves the calculate resistance level at 0.2734 USDT I might consider entering long position anticipating further upward movement.
Pivot Point Reverse Trading:
- This strategy involve trading reversals at pivot point level.
- If the price of Steem coin reaches the first resistance level (R1) 0.2734 USDT I may consider entering a short position expecting the Price to reverse and moved back down.
Adjusting to Real Time Data:
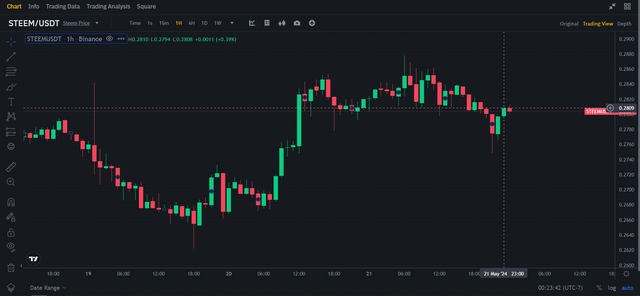
- Steem Coin Price:
On 21 May 2024
High Price = 0.2809 USDT
Low Price = 0.2749 USDT
By incorporating this real time data into my analysis I can adapt my treding strategy to current markets conditions. For example if the price of Steem coin deviate significantly from the calculated pivot points I may reassess my trading decision and adjust my Entry and exit point accordingly.
| Pivot points serve valuable tool in my trading journey providing clear level of potential support and Resistance that help me makes inform trading decision. By continuously monitoring the market and incorporating real time data I can Optimized my trading strategies and increase my chances of success. |
|---|
i am inviting: @ikwal @mireyalongart @sofian88
.jpg)
.png)
.png)
.png)
.png)
.png)
.png)
.png)
.png)
.png)
.png)
.png)

.png)
.png)
.png)
.png)
.png)
.png)
.png)
.png)
.png)
.png)
.png)
Upvoted. Thank You for sending some of your rewards to @null. It will make Steem stronger.
Greetings my friend @hamzayousafzai,
Wow, your explanation of candlestick charts is clear and super helpful! 📈 That part about reading patterns is especially awesome! 😄 Keep it up! 🎉
All the best in the contest, success for you👍.
thank you so much for your encouragement
This highlights the significance of technical expertise in trading, emphasizing its pivotal role in understanding market dynamics and making informed decisions.
You've illustrated a strategic approach in technical analysis, suggesting that recognizing support levels can signal opportune moments for purchasing assets, enhancing trading effectiveness.
You've emphasized the proactive stance in trading, indicating that staying vigilant and integrating up-to-date information can refine trading tactics, ultimately boosting the probability of achieving successful outcomes.
All the best
thank you so much for your feedback
Your explanation of the continuation and Reversal Patterns is on point. The method of technical analysis explanation as well as it's significance is on point.
You've done good work explaining this topic. Best of luck to you
Regards,
Dr Huzaifa Naveed
thanks for your feedback
Your argument on technical knowhow in trading is enlightening. One way that understanding market trends and patterns can improve trading decisions is by using price charts such as line and bar charts. The examples you give depict these concepts as relatable and pragmatic. Good work!
Thank you for your kind words I m glad to hear that you found my explanation on the importance of technical knowledge in trading enlightening.
Greetings @hamzayousafzai,
You really simplify why knowing technical stuff is super important in trading, like comparing it to traffic signals, which makes it easy to get. Your focus on using indicators to figure out market movements is explained well. Explaining the different parts of candlestick charts and what they mean in trading is really helpful. Also, talking about the different trading styles depending on the timeframes is a nice touch, it helps readers see how to use strategies in trading. You make it clear how continuation and reversal patterns are different, which is key for smart trading. The tips on using these patterns to set stop-loss orders are practical and valuable. Your explanation of using TradingView and technical indicators for real-time trading is simple and useful for people new to the platform. The part about pivot points is well done, especially the math stuff and why it matters in trading. Your advice on how to set up and trade with pivot points is great for putting into action.
Like always, you always deliver on your explanation and research. All the best my friend.
Thank you so much for your thoughtful and detailed feedback I am thrilled to hear that my explanations are resonating with you and helping to simplify complex trading concepts.
Is such an honor to go to your article again my friend you wrote with pure knowledge and experience and I must say you deserve some accolades for such amazing job.
The Bollinger Bands are one of my favorite technical indicator tool that I use to predict the price of crypto asset at every period of time, this is because it is very efficient, effective and simple to use because the data are self-explanatory
Thank you friend for sharing such amazing content, you are invited to comm on my entry through the link below https://steemit.com/hive-108451/@starrchris/sec-s18-w1-or-or-mastering-the-markets-with-technical-analysis
thanks for your feedback i am also going to check your entry
Este desafío esta aguerrido luego de recorrer los diferentes post, existen muchos post de buena calidad en la presentación y el contenido, incluyendo éste.
Cada vez que incursiono en estos temas nuevos para mi, aprendo algo nuevo y repaso otros ya estudiados.
Gracias por compartir, te deseo mucho éxito y bendiciones en tu participación.
¡Un fuerte abrazo!
thank you so much for your feedback
I'm always impressed learning from experts and then arriving at my expectations
I see you've a premium knowledge about technical Analysis from the candle Sticks, Volume analysis, Support and Resistance level, the Indicators like EMA, MACD, moving averages, pivot points, RSI, Market Trends and Many more.
I acknowledge these as the top and best for any trader no matter what you're trading on.
I'll love reading more from you.
Thank you so much for your kind words! It's always encouraging to hear that my expertise is appreciated.