Crypto Academy Season 2: Week 2 || Homework post for @stream4u||
Hello all, and welcome to Week 2 of Season 2 of my homework update. Respected Professor @stream4u delivered an extremely thorough and well-explained lecture. Let's get this party started, shall we?
Question 1: What is price forecasting and why is it important?
To put it another way, price forecasting is a technique that allows a user to predict the future price of an asset.
Trading is done on the basis of price forecasting, which is done with the help of the user's analysis. Technical, Fundamental, and Sentimental methods are used to carry out these analyses. These techniques will be discussed in more detail later in this article. Price forecasting is a technique that allows a trader to get a clear picture of the market trend. It helps in getting clear idea where to enter and where to exit the market
Price forecasting is critical in the world of trading. Trading is nearly impossible without forecasting, and it can result in a significant loss for the trader. One cannot enter the market or exit any position taken without first determining the market's direction. Whether trading cryptocurrency or other assets, the trader must first analyse the market before entering it by purchasing an asset. Price forecasting is required for proper trading; otherwise, it is akin to gambling.
Question 3.\sDifferent methods of Forecasting.
To analyse the market, three different methods are employed. These procedures are outlined in the following sections.
. An examination of technical issues.
The user uses technical indicators to analyse the market in this method. These can be Support & Resistance, Moving average, Chart analysis, price action signals, trend changing indicators etc. All of this information came from previous classes.
A trader might enter the market by purchasing an asset at a support level and exit the market by selling the asset at a resistance level, for example. This is referred to as technical analysis.
- Analysis of the fundamentals
In this method, trader does not look at chart patterns and he evaluates the market by the factors that can influence the value of an asset. These analysis are usually carried oit on the basis of financial statements of the asset and other external factors that can influence the future price of the asset. Any changes in management have the potential to affect the asset's future price.
For example, When any institution announces to affiliate or adopt a blockchain, then it can be perdicted that that crypto asset will go upwards. Fundamental analysis is the term for this type of analysis. Traders who trade fundamentally will enter the market as a result of such a statement.
Another example is when Elon Musk tweets about Dogecoin, and you can see that it has progressed since then.
Modes:
6
- Sentimental Analysis.
In this kind of analysis, a trader analyze the market on the basis of news, media and other discussion in the forums. Such news create panic situation and these traders try to take advantage of such like situations. There is too much volatility involved in such situations and it s effect can be both negative or positive. In these situations, market moves very fastly and such traders earn or loose in very short time.
In this method of analysis, a trader tries to understand the sentiment of the general traders, whether it is positive or it is negative. Sudden good or bad news can aslo effect the value of an asset. This method is usually used in addition to Technical or Fundamental analysis and it can also be very helpful in analyzing the market
Sentimental Analysis is the third step in the analysis process.
In this kind of analysis, a trader analyse the market on the basis of news, media and other discussion in the forums. Such news creates a panic situation, and these traders try to take advantage of it. In such circumstances, there is far too much volatility, which can have both positive and negative consequences. In these circumstances, the market moves very quickly, and traders earn or lose money in a very short period of time.
A trader uses this method of analysis to try to understand the general sentiment of traders, whether it is positive or negative. The value of an asset can also be affected by unexpected good or bad news. This method is usually used in addition to Technical or Fundamental analysis and it can also be very helpful in analysing the market
Which approach is the most effective?
The two most common methods for analysing the market are technical and fundamental analysis. Both are crucial, and they are extremely beneficial when trading any asset.
Technical Analysis, in my opinion, is superior to all other types of analysis because it has proven to be extremely reliable and has been used by traders for many years. When such a situation arises, fundamental analysis will come in handy; otherwise, technical analysis is best for day-to-day trading.
Question 4: In this section, I'll try to explain how to use Technical Analysis and various tools on chart patterns to forecast prices.
steem 19-4.png steem 19-4.png steem 19-4.
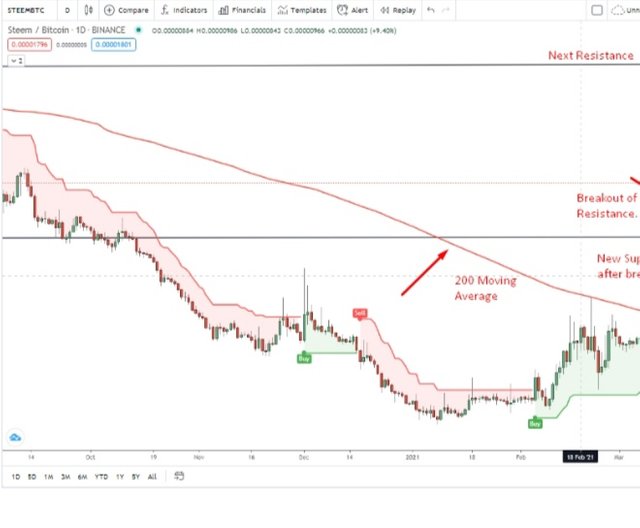
Resistance to Breakthrough
In the above screenshot, I have mentioned 200 Moving Average and new support level. It is now acting as Support following the breakout of this resistance. I also used the SuperTrend Indicator, which predicts that steem will increase in value. The Moving Average has also been broken to the upside, indicating an upward trend. After a breakout, the market usually returns to the new support level to test it. If it succeeds in providing support, the market will resume its upward movement to the next Resistance Level.
19-4.png steem steem steem steem steem ste
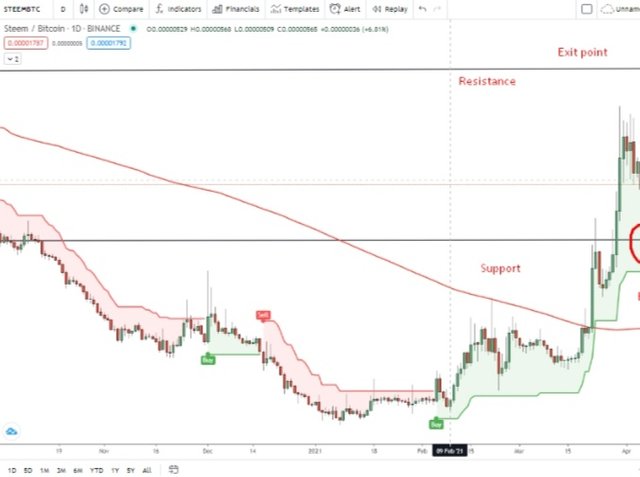
Points of Entrance and Exit
The entry point, as shown in the diagram, is the point at which a trader must enter the market by purchasing the asset. The support line is frequently used as a point at which the market is rejected and moves upward. It has acted exactly as I predicted in this picture, and it has returned to the next level, which is the resistance line.
When the market reaches the resistance line, the trader should exit because the market could return to the support level from this point. On the basis of the chart, I believe the market will revisit the support level before moving upwards to the resistance level.
want to give Source of my post of 06-04-2021 that was about my perdiction on steem and the market acted the same way. You can also visit my post.
Conclusion.
Technical Analysis and Fundamental analysis are both very important and these are the methods that are widely used by the traders to analyze the market. On the basis of these analysis, market price forecasting is carried out and then the traders enter the market. These are very helpful methods and without analysis, trading is nothing but loss.
Hi @hamidsab
Thank you for joining The Steemit Crypto Academy Courses and participated in the Week 10 Homework Task.
Your Week 10 Homework Task verification has been done by @Stream4u, hope you have enjoyed and learned something new.
Thank You.
@stream4u
Crypto Professors : Steemit Crypto Academy
Thank u sir
Use proper tags in the first 3 places, once done reply to me here.
#cryptoacademy , #stream4u-s2week2, and #cryptoforecast