Crypto Academy Week 14- Homework post for Professor @kouba01
Imagine you could bet on the momentum of a moving train. You put one dollar on every meter it moves after the breaks are hit.
Say the train goes an extra mile before coming to a complete stop, that means you would have gained a thousand six hundred dollars from “Physics”!!!!.
I guess that would have been the best betting sport, well trains always have a momentum so you can always be sure of winning.
What if the market was like a moving train also having a momentum? Where we say:
- Market price ≡ (is equivalent to) Velocity of the train.
- Demand and supply (Trade volume) ≡ mass of the train
- Change from demand to supply ≡ Brakes applied to the moving train.
Now we can use a Tachometer to measure the speed of the train and with the help of Physics, knowing the mass of the train we can calculate for momentum. But how do we calculate for the momentum of price? What do we use as a yardstick to be able to stake our money on the market’s momentum?
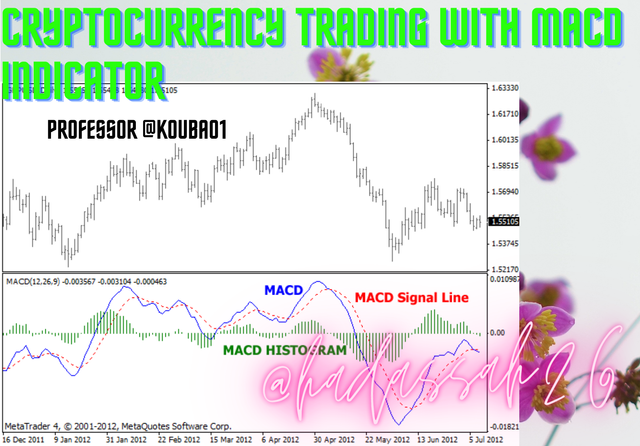
Good day beautiful Steemians, I am @hadassah26 welcome to my week 14 Steemit Cryptoacademy homework for professor @kouba01

”1a. What is the MACD indicator simply?”
The moving average convergence divergence indicator, an oscillatory indicator, sister to likes of the Relative Strength Index (RSI) and Stochastic indicators. It was developed by Gerald Appel in the 1970s.
The moving average convergence divergence indicator which is best known among traders as a market momentum indicator gives traders a cue of the strength of the market and good signals of market pump and dump areas.
This invaluable indicator which is made up of other indicators calculates the difference between the 12 Exponential Moving Average (EMA) and the 26 Exponential Moving Average (EMA) indicators, along with another 9 exponential moving average signal indicator and then a histogram. Let me explain better:
The MACD line:
This is the difference between the 26 EMA and the 12 EMA. It is the major line to look out for on the MACD indicator. It is the white line in the pic below:

The Signal line:
The signal line is a 9 EMA line on the MACD indicator. it is more of a confirmation line for the MACD line during crossovers. It is the dotted red line in the picture below:

The Histogram:
The Histogram is a deviation between the MACD line and the signal line. The histogram makes reading the deviation between the MACD line and signal line easier, with its bars easily showing retracements implying price strength decline. Picture below:

The Zero Line:
This is the center line of the MACD chart. it is the line which the 3 indicators oscillate about. It is also the difference between the 26 EMA and 12 EMA of the MACD line. Picture below:

”1b. Is the MACD Indicator Good for Trading Cryptocurrencies?”
The MACD indicator is great for trading crypto currencies since it gives traders an insight of the strength of the coin in the market, in fact I will say the MACD is not just great, it can be invaluable too.
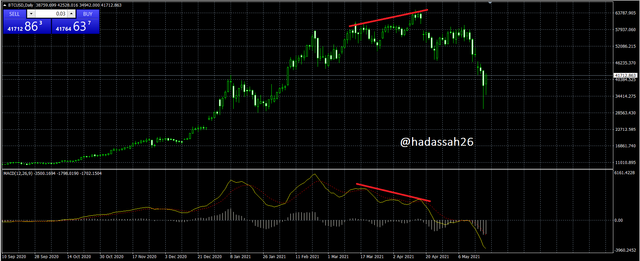
Taking for example, the very recent dump made by the Bitcoin, this had shown days before on the MACD with a strong bearish divergence showing during the past week giving off a buy strength weakness. Noticing this, smart traders must have taken it into considerations and made right trading actions.
So once again, yes the MACD is good indicator for cryptocurrencies.
"1c. Which is better, MACD or RSI?"
Hmmm, well here if I were asked which is more technical, or involves more mathematics which should prove better I would have been quick to point at the MACD indicator. But in Crypto trading, sometimes the basic things can be very important. But back to the question which is better, for me I would say the MACD is because it not just only gives the strength of the market, it also signifies us of when to start watching out for change in trend by its histogram. So the MACD is more functional than the RSI therefore to me better than the RSI.

”2a. How to add the MACD indicator to the chart”
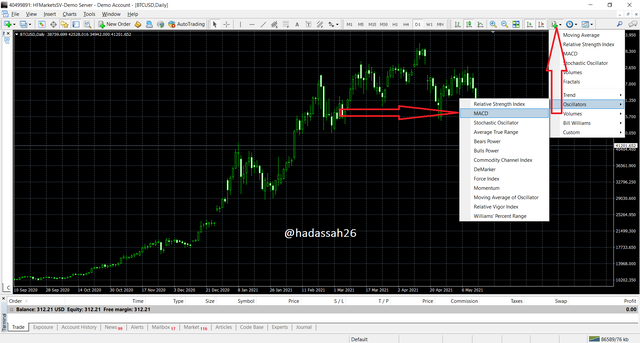
To add the MACD indicator to a chart, I will be using my MT4 for this exercise, so I will be explaining using its interface.
- I open my MT4 and select the chart I wish to trade:
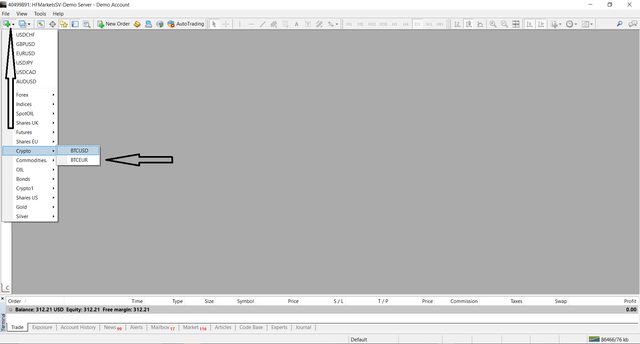
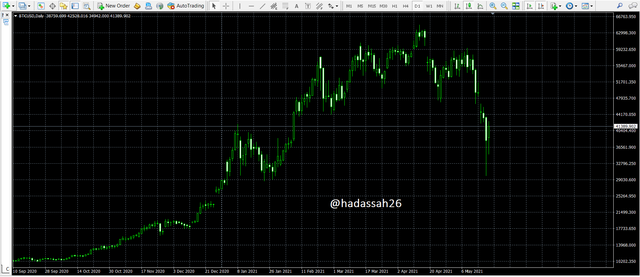
2, With the selected chart opened, I click on the Fx+ icon and click on Oscillators and then MACD.
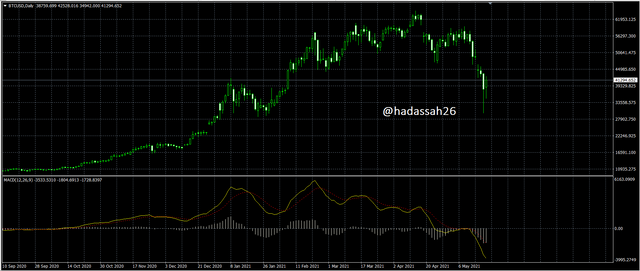
”2b. What are its settings, and ways to benefit from them?”
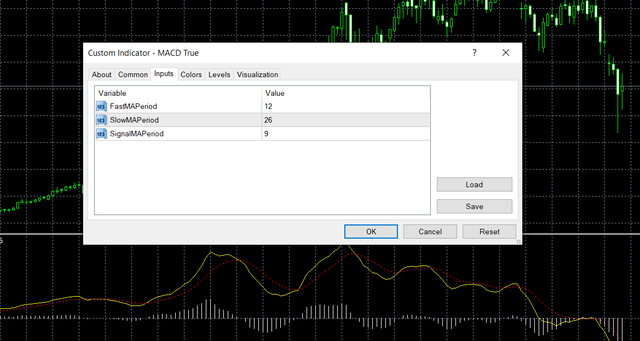
When I first opened my MACD it had dull colours, I could not see the MACD line properly so here I can now benefit from the setting, I double click on the MACD and the setting pops up.
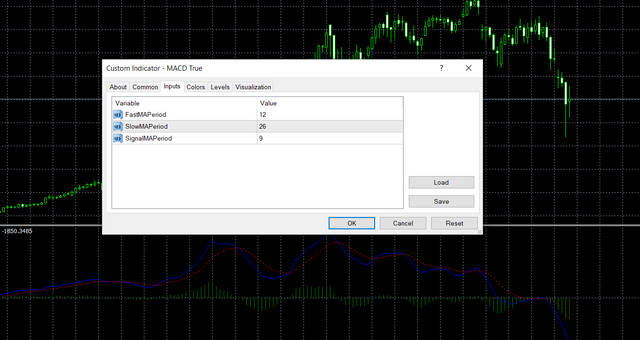
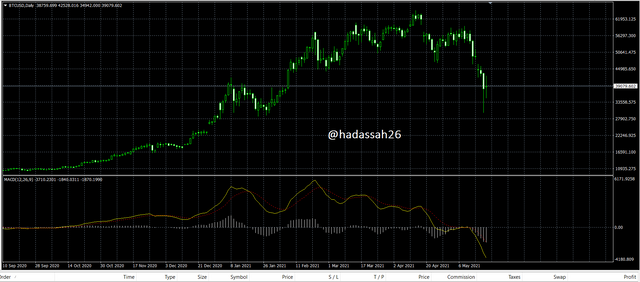
I go to the colours and change the MACD line colour from blue to yellow, and the histogram colour to ivory white:
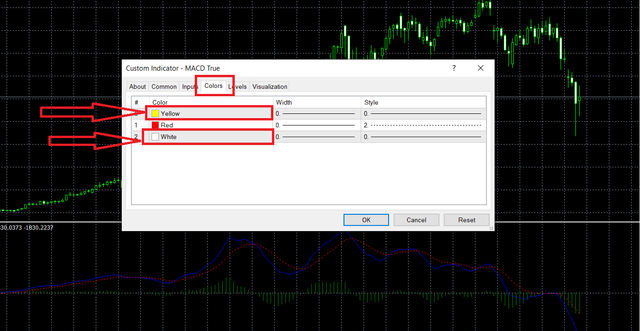
MACD looks better now:
Secondly, sometimes some markets can be pretty fast, so we may need a faster moving oscillator indicator to track them, here we can edit the parameters of the MACD indicator maybe by changing the MACD line to the difference of the 15 EMA and 8 EMA. And maybe the signal line to a 5 EMA.
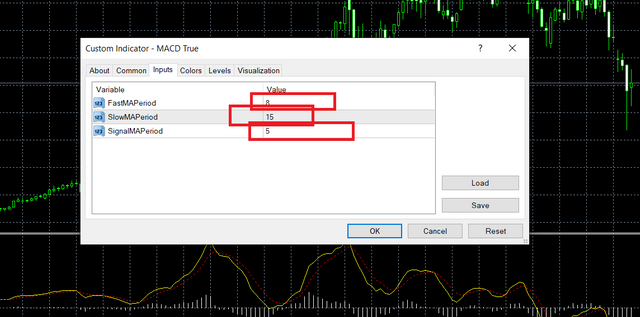
Note:
One should be careful when editing the parameter indicators of the MACD, very fast signals can easily give off wrong signals. secondly since the default signals of the MACD are already generally accepted, trading on your own setting may make you a lone trader which can be dangerous.

”3a. How to use MACD with crossing MACD line and signal line?”
When the MACD moves past the signal line, it signifies confirmation of a new trend entry, this is best used on longer time frames, for example looking at the two examples below:
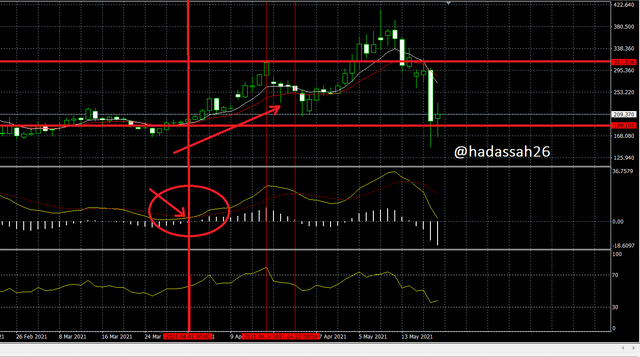
Here on the LTC/USD daily, the MACD shows a good reversal after the the histogram shows some retracement to the upside the price of the Lite coin sees an upturn and moves 189 USD to 311 USD.
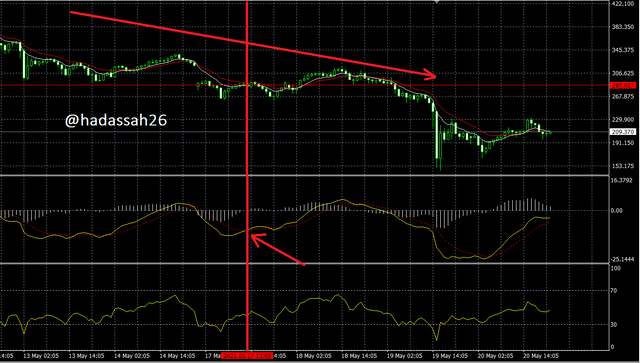
Here we see on the LTC/USD hourly chart that the crossover of the MACD and signal line doesn’t really give a good signal, as price continues to trend downwards before hitting the previous resistance and rebounding up wards.
Also we should note that the MACD line and signal line are exponential moving averages which are faster or would I say more sensitive moving averages. As much as they give faster signals unlike the more lagging Simple moving averages, they can also be quick to give false signals.
So trading crossovers of the MADC and Signal line which should mean a new trend should involve some form of confirmation. Example of the confirmations, confirmations from price action, watching a higher time frame, watching for divergences, and even confirming from a second indicator.
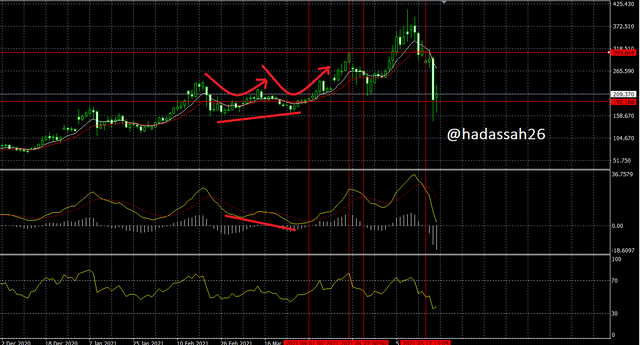
Zooming out on the First picture above, we can now see that price was facing a retracement, downward after the first bull run, this retracement, which soon found some weakness forming a hidden bullish divergence, and forming an inverse double top.
This is a good backup signal for the MACD, signal line uptrend crossover signal. This gives like an 80% confirmation of a buy entry into the market.
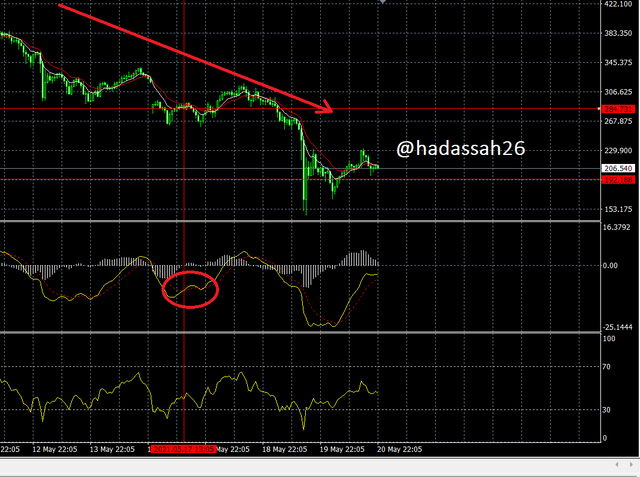
On the previous chart we can only see that the market was in a strong down trend, and was only finding some retracement, which quickly turned back to a new down trend continuation.
Secondly we see this is on an hourly chart which is susceptible to the Daily chart.
"3b. How to use the MACD with the crossing of the zero line?”
In trading, sometimes we miss the first entry positions what we call “The ship has sailed", leaving us behind. This which usually starts when the MACD line crosses the signal line. We though can also find another entry position for this sailing ship.
When the MACD line crosses the Zero line, it is usually a signal of reconfirmation of trend continuation. A proof of the incumbent trend and even a continuation of the trend.
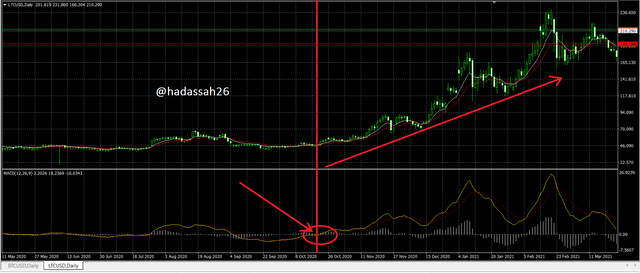
It should also be known that the MACD line crossing the Zero line is actually the 12 EMA crossing the 26 EMA since the MACD is a difference line.
Although sometimes it takes a while before the MACD line crosses the Zero line on higher time frames mostly due to strong buy or sell trends, using the MACD line crossing the Zero line should need some price action recheck, and confirmation maybe with the RSI or stochastic indicator.
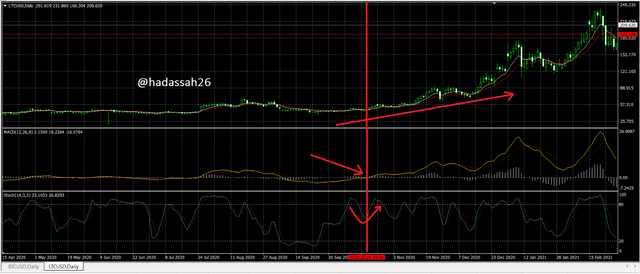
Here we can see that the Stochastic Oscillator had shown a new trend formation just before the crossing of the MACD line over the zero line.
The 8 and 15 exponential moving averages are also in an uptrend, signifying strong uptrend continuation, so the MACD line crossing the Zero line shows a good uptrend re-entry confirmation.

”4a. How to detect a trend using the MACD?”
I will be answering this from my own personal experience. The MACD is a great indicator as regards trend detection as it is very sensitive to price momentum.
The histogram of the MACD indicator is most sensitive as its bars show the deviation between momentum.
To detect a trend using the MACD indicator, we have to first:
Watch the histograms:
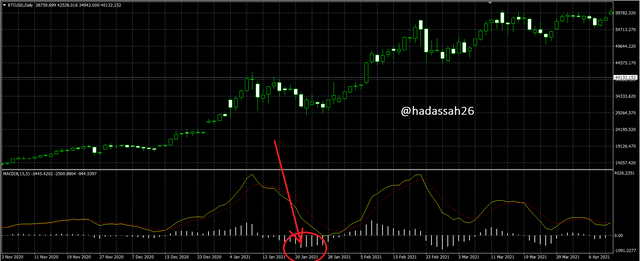
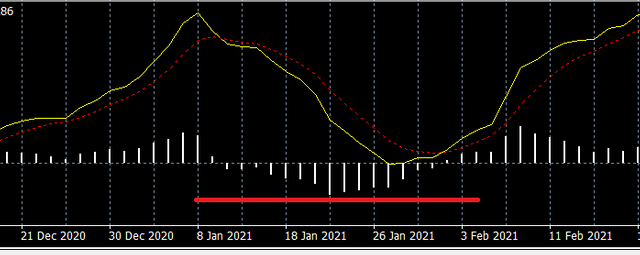
With the histograms showing an impending sign of change, when they make either very low bars in the down trend and quickly start retreating or vice versa on the uptrend, we should start expecting old trend ending and retracement or even a reversal.
When we see these signs we must be careful to work under longer time frames as shorter time frames are influenced by the longer ones.
Next we check for crossovers between the MACD line and the signal line, looking back at the chart we can see that the MACD line soon crosses the signal line just after the histogram changes momentum.
Now we are 50 % sure it is a new trend forming.
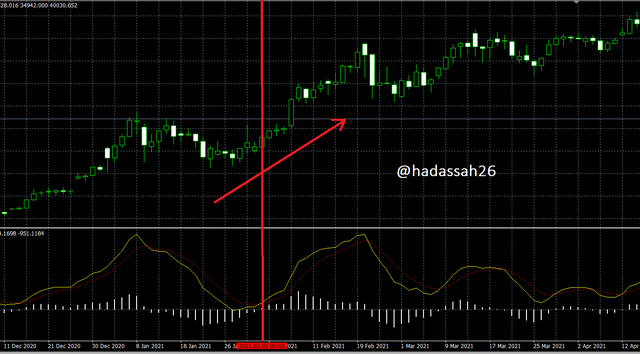
Now we can check for divergences, reconfirmation on another indicator, price action etc.
On the price action, we see price had made a downward facing wedge. This shows a retracement and a cue for a new trend.
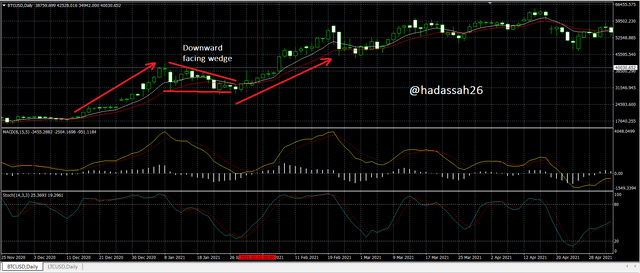
Price action here has proven to support the MACD indicator, we can now enter a buy trade and await profit.
”4b. How to filter out false signals?”
As we can see from previous analysis, filtering wrong signals from the MACD indicator involves good price action analysis, watching longer time frames and maybe another indicator for confirmation. Let me explain properly:
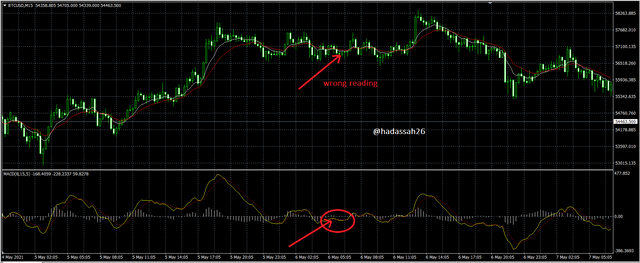
As we can see in the BTC/USD chart above, we are watching the 15 minutes chart.
Here the MACD line crosses the signal line, giving a buy trend signal as previously indicated, but we can see that the price keeps consolidating around the same price range. This is a bad reading of the MACD.
To avoid and filter bad readings from the MACD indicator, we should first check the price action, then view price from a higher time frame.
Then we can confirm with other indicators (maybe trend indicators such as the moving averages) before confirmation.

We can see from the price action that the market is currently consolidating. This is not the best time to go into the market as indicators are only mathematical equations and not artificial intelligence to detect when the market is not in a good state of entry.

"5. How can the MACD indicator be used to extract points or support and resistance levels on the chart? Use an example to explain the strategy."
Most Oscillator indicators give resistance and support signals on their reversals/crossovers.
The MACD oscillator indicator is no exception, giving resistance and support regions during its crossovers with the signal line.
For example, looking at the below, we can see that at points a, b, c, d, e circled e below. As the MACD crosses over or below the signal line, it corresponds with resistance and support regions.
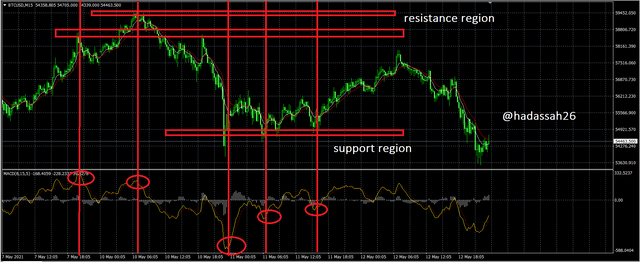
This method can also be used to detect divergences and tell previous highs and lows of the market.

"6. Review the chart of any pair and present the various signals from the MACD"
Reviewing the BTC/USD. we can see that after the recent dump, the MACD histogram has gone really far down signifying a big deviation between the MACD line and signal line.
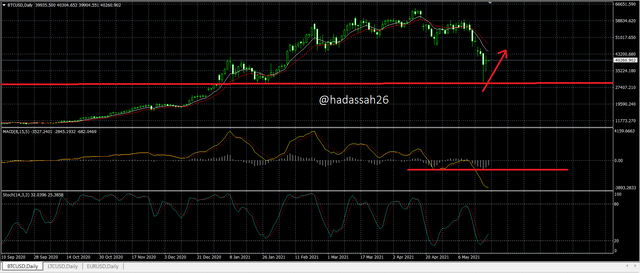

This shows for some retracement, From the immediate support zone at 30k USD up to the next resistance at 45k USD then some consolidation.
So I expect the BTC to consolidate at 42k USD, before another rise or fall (This which should be due to general market sentiment).
Confirming with the stochastic oscillator, we can see that the Oscillator shows a retracement signal. this is a re-confirmation of the BTC going back to say 42k USD and then some consolidation.


On conclusion. If we can now decipher the future velocity of the market (future market price) knowing when the brakes were hit on the market (when MACD histogram started to retreat), and being sure of the mass of the Market (market volume), we can now calculate our future profits.
- In Physics we calculate momentum with : Mass *(multiplied by) Velocity.
- In Crypto Market, we calculate the momentum of the market with the: MACD.
Trading the MACD should be on higher timeframes, this way you can be sure of better signals. Also the MACD should not be traded on ranging/consolidating markets, this would bring about erroneous readings.
Lastly price action and other indicators should be confirmed before making decisions with the MACD indicator.
The MACD indicator is a great tool to traders and it is still the best market momentum indicator, it has lasted more than 50 years now among financial market traders and is still proving to be an invaluable trading tool.
Thanks.
CC
@kouba01
Hello @hadassah26,
Thank you for participating in the 6th Week Crypto Course in its second season and for your efforts to complete the suggested tasks, you deserve a 10/10 rating, according to the following scale:
My review :
I liked the way you went into the matter by relying on the analogy between betting on the momentum of a moving train and trading in the cryptocurrency market to illustrate just how important indicators are. Yes, this is a kind of creation in writing.
As for the remainder of the article, you did a wonderful job in research and analysis to answer questions in an accurate and clear manner, it s an integrated work in form and content.
Thanks again for your effort, and we look forward to reading your next work.
Sincerely,@kouba01
Wow, thank you professor. I really do appreciate.