Crypto Academy Week 12- Homework post for Professor @kouba01
We all want to buy when prices are low and sell when prices are high.
Crypto prices fluctuate with a high volatility based on continous traders sentiment and psychology.
In 1978, WIllis WIlder developed the Relative Strength Index, a trading tool to enter the market at a preferably lower price.
Good day Beautiful Steemians I am @hadassah26 and this is my week 12 homework for professor @kouba01 on: Cryptocurrency Trading with RSI.

”Question 1a. What is the Relative Strength Index - RSI?”
The Relative Strength Index is a crypto and trading indicator which is under the group of oscillatory indicators because they move from a range of zero to a certain number and back depending on price action, giving a signal on price momentum.
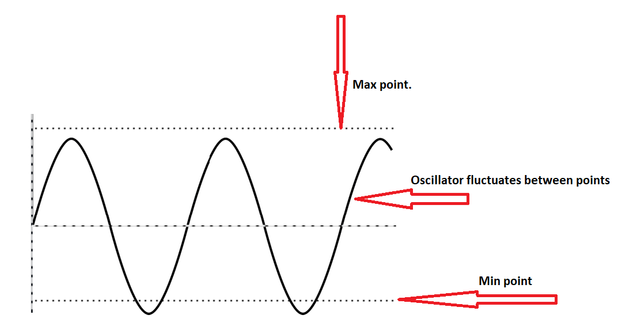
The Relative Strength Index indicator is a line oscillating Indicator used to determine when price is over valued or under valued using the recent market trend.
I personally call the relative strength index a market value meter for price, this which is because it reads from hundred to zero the current market value of price, telling when price has been over or under valued and needs to correct itself.
”Question 1b. How is it Calculated? ”
Calculating the RSI involves two steps, first step to get what I call the rough RSI, and the second stem a more smoothening effect on it.
The first step is:
where RS = (Average gain in 14 periods / Average loss in 14 periods)
This which gives a rough calculation can be made smoother by making a new RS.
New RS = (((Former average gain * 13)+current gain) / 14) / (((Former average loss * 13) + current loss)/14)
therefore smooth RSI =
let smoothened Averages be equal to x1 (smoothened average high) and x2 (smoothened average low)
New simplified RSI =
From the calculation, we see that the relative strength index depends on the current price trend as it uses the immediate 14 days average highs (x1) and the immediate past 14 days average lows (x2) as parameters.
This means we should be able to adjust our relative strength index by either bringing down the 70% line during steep down trends, or taking up the 30% line during steep uptrends.
”Question 2. Can we trust the RSI on cryptocurrency trading and why?”
Price pattern is always in trend and the relative strength indicator gives the current trend’s market value, more like the market value meter reading.
So when using the relative strength indicator one should know it is subject to price trend.
Understanding that the the relative strength indicator works more like a meter rather than a soothsayer, it becomes very reliable to traders as an indicator to know when they may be over paying on market price, and when the price is also being undervalued.
So yes, we can trust the Relative Strength Indicator since it signals us of the current market price deviation from the past 14 days or any other pre-set period.
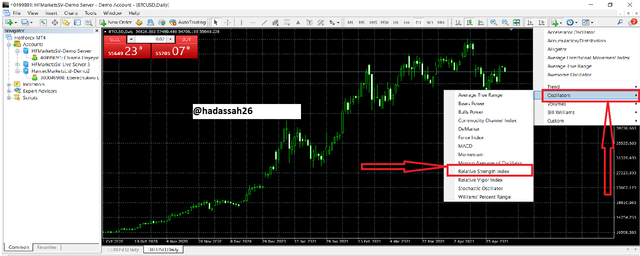
"Question 3a. How do you configure the RSI indicator on the chart ?"
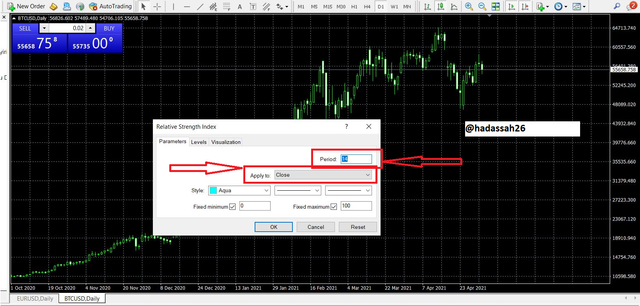
I configure my RSI indicator using my MT4 trading app by :
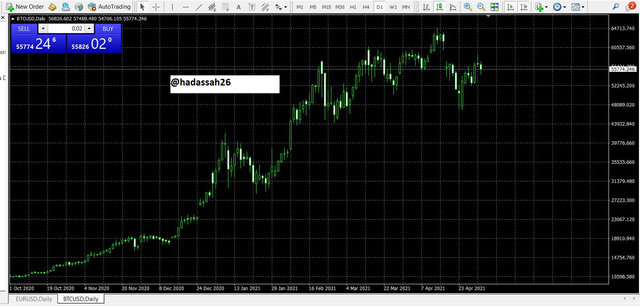
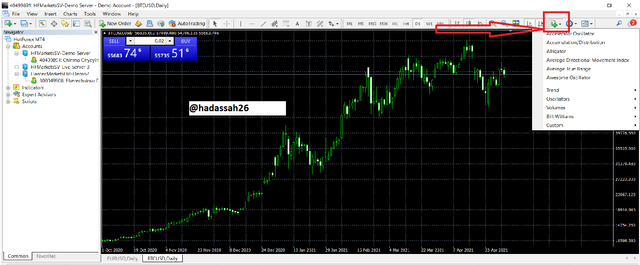
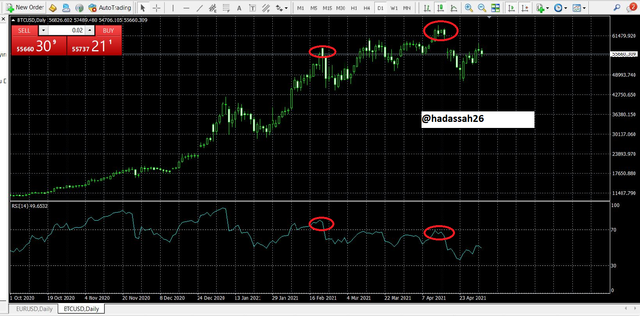
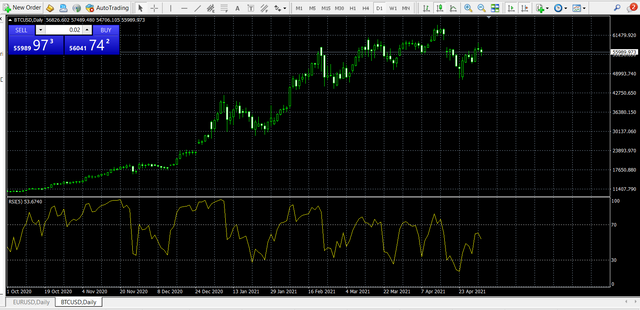
Below is the RSI indicator on the BTC/USD chart on my MT4, as we can see it peaks when price is high and signals over sell and buy positions:
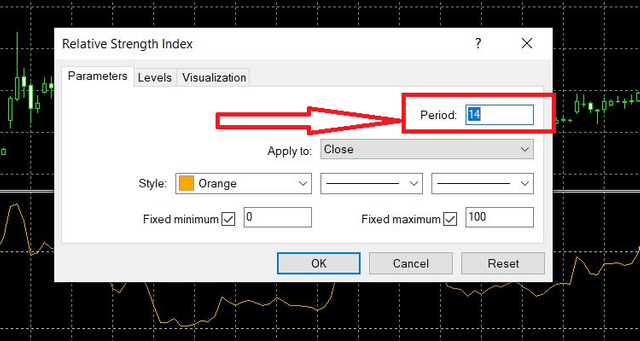
"Question 3b. Why is it equal to 14 by default?"
I will say the length parameter of the RSI is equal to 14 by default as an empirical value.
The length parameter which means period can either be 14 days if it is in the daily chart, or 14 weeks if it is in the weekly chart, or 14 hours if it is in the hourly chart. This which aggregates the past 14 days, or weeks or hours taking enough data (not too little, and not too much) to calculate the current RSI reading.
”Question 3c. Can we change it?”
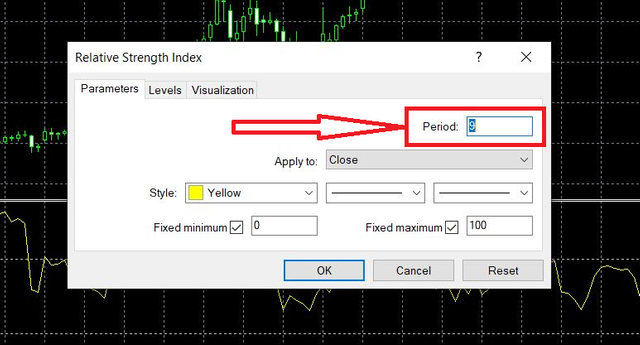
Yes we can change the Length parameter if we want in the configuration window. I will be showing how to change the RSI length parameter from 14 to 5 periods below:
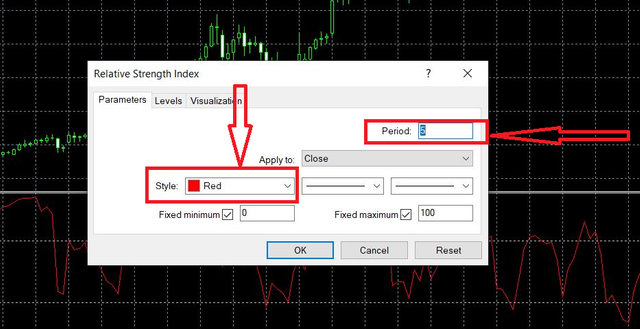
Below is the new RSI on my BTC/USD chart. it now looks more noisy and bumpy.
"Question 4. How do you interpret the overbought and oversold signals when trading cryptocurrencies? (Screen capture required)?"
First I must say the the RSI signal depends on price trend and so isn’t really a static 70, 30 line signal, it is more dynamic as with steep uptrends we tend to increase our 30 line to say 40 or even 45 and on steep down trends we can reduce our 70 line to say 60 or 55 so as to accommodate for dips and retracements.
Interpreting the RSI indicator involves first drawing two standard lines, although they may be already drawn for you, these lines signal when the price is becoming over sold or over bought.
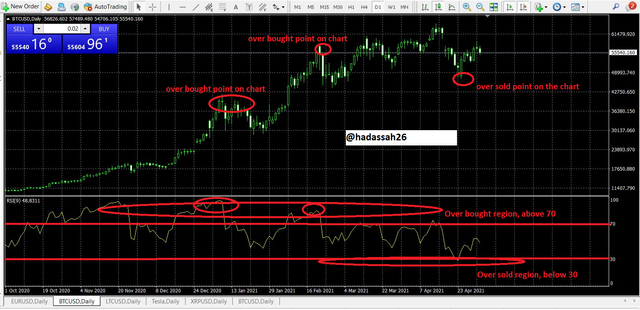
When the RSI line reaches the 70 line mark is shows that the market is becoming over bought and should entering should involve caution. Also when the RSI line reaches the 30 line mark, it shows the market is becoming over sold and so entering sell positions should involve caution.
"Question 5. How do we filter RSI signals to distinguish and recognize true signals from false signals. (Screen capture required)?"
All markets are different in volatility, the length parameter of the RSI indicator also increases or decreases its volatility (as it reduces the noise). So an experienced trader should be able to tell how volatile a market is and be able to adjust his RSI to give more detailed signals.
I will be using the BTC/USD and ETH/USD charts for example:
The BTC/USD pair has the most volume of all crypto trading pairs, there it tends to fluctuate more and, so it needs a faster RSI. Now I will be using a 9 period/length parameter for the BTC/USD:
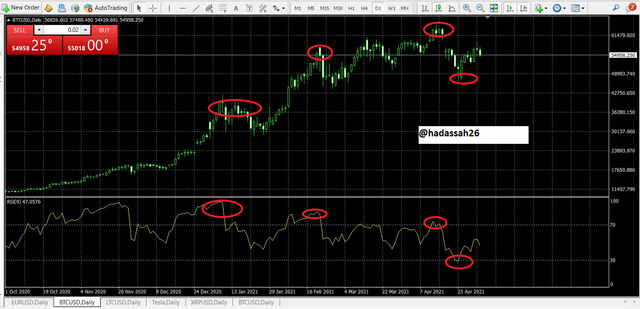
As we can see it captures most highs and lows since it is a faster RSI. This signifies me quicker of when to enter or leave the fast moving BTC/USD market.
On the other hand, the ETH/USD is less volatile and so I am using the standard 14 period/length parameter:
As we can see here the price is less volatile and the RSI fits it better giving us more accurate reading on entry and exit points.
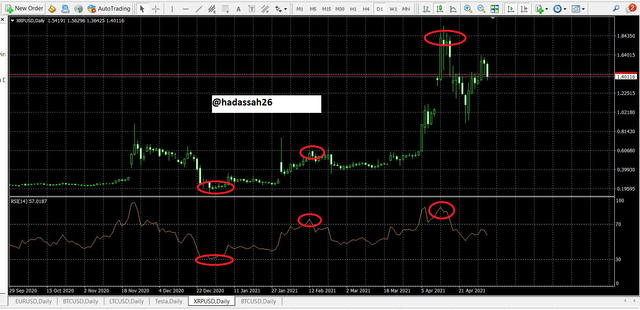
"Question 6. Review the chart of any pair (eg TRX / USD) and present the various signals from the RSI. (Screen capture required)"
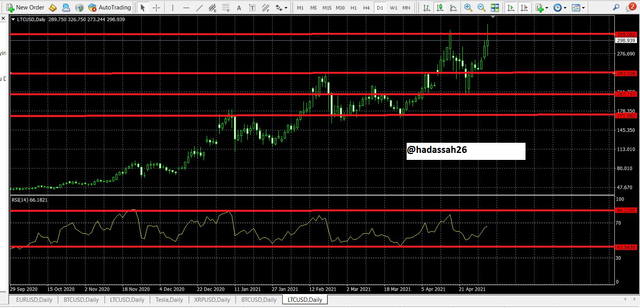
For this I will be using reviewing the LTC/USD using the RSI indicator as the only indicator.
Looking at the LTC/USD chart, I have drawn my resistant and support zones at 309 immediate resistant line, and 244, 201 and 171 support zones.
I have also increased my RSI lines with my 70 margin now at 84, and my 30 margin at 42. This which is because the price is currently in an uptrend.
Next I have also added another resistance line on my RSI and I can see my RSI is in resonance with my price. Giving good over sold and over bought points.
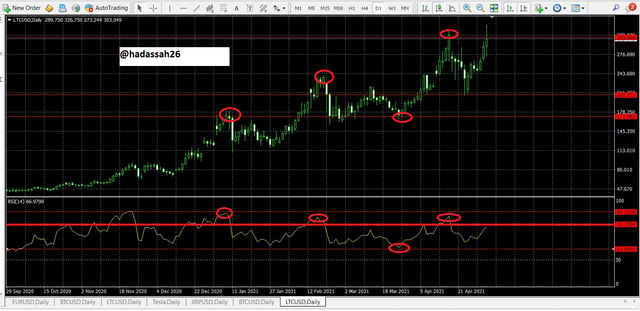
Now to analysis, I can see that there is a current regular bearish divergence happening from the previous highest high and the current highest high.
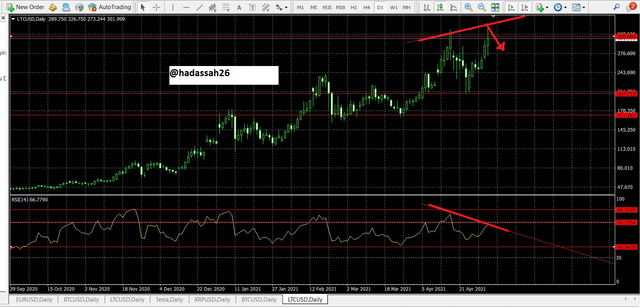
This signifies weakness in buying power of the LTC/USD. We should be expecting some sell in the next few days, maybe to the closest support at 244.
This shows that buying LTC now would need some strong fundamental and or sentimental signals.
The Relative strength indicator (RSI) is a great trading tool, as good as the candle stick itself as it serves as a meter to read market value. Using the RSI needs some form of experience with price volatility and knowledge of market trend, this way U one can adjust the length parameter and over sold and over bought lines to fit the current market and trend.
All indicators still give a little off reading sometime maybe because of noise or sudden price movements, but that is part of the risk right?
Thanks.
CC @kouba01
Hello @hadassah26,
Thank you for participating in the 4th Week Crypto Course in its second season and for your efforts to complete the suggested tasks, you deserve a 9/10 rating, according to the following scale:
My review :
A work of excellent content in which you answered the questions with an analytical dimension and gave your opinion on several points, but you did not succeed in answering the question related to filtering the wrong signals and the correct signals. I would like you to follow the reform at the end of the week.
Thanks again for your effort, and we look forward to reading your next work.
Sincerely,@kouba01
Thanks sir @kouba01 I appreciate